
XRP Price Prediction: Flag Pattern Sets Stage for 40% Price Rally


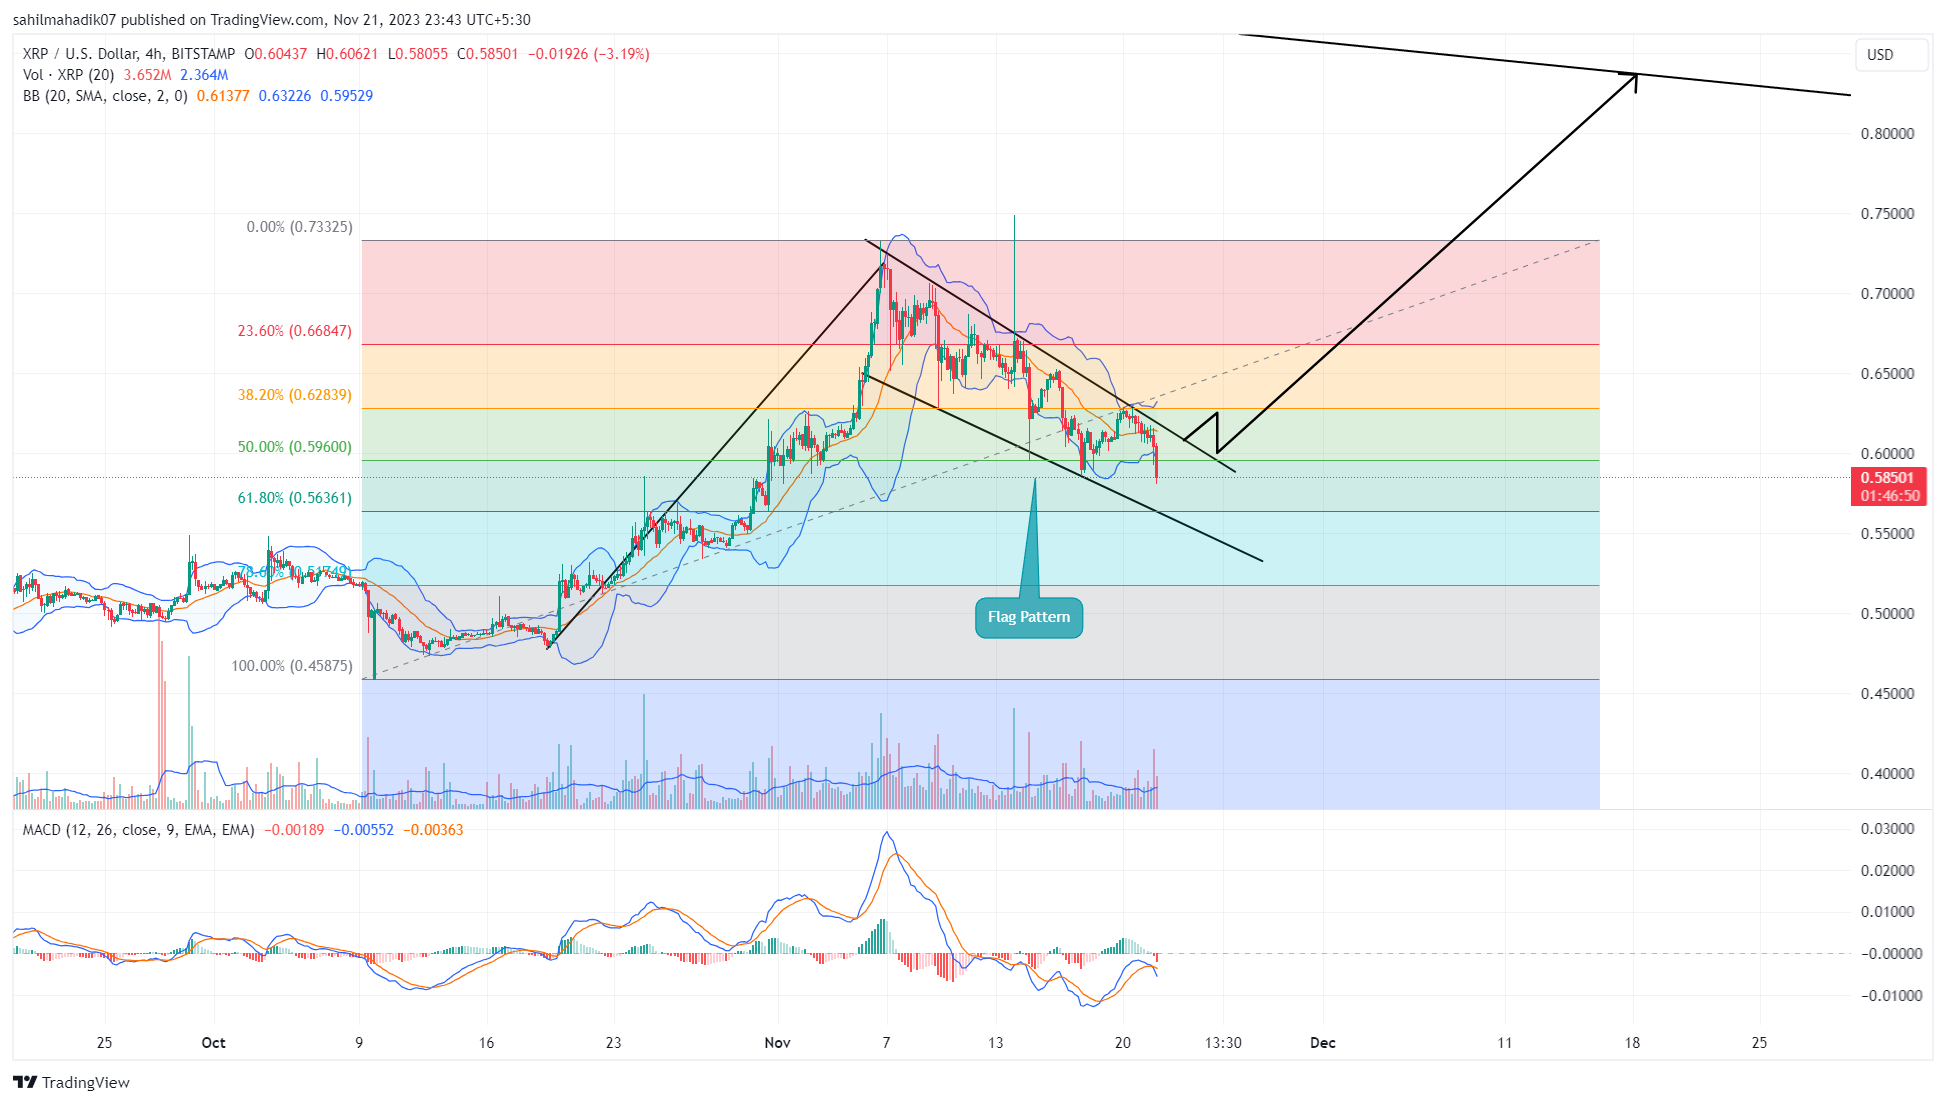
XRP Price Prediction: In the context of current market volatility, the fifth-largest cryptocurrency XRP, has undergone a notable reversal from its recent peak of $0.73. Over the past two weeks, the value of the XRP coin has decreased by 20%, resulting in a current price of approximately $0.6, and its market capitalization has fallen to $32.4 billion. However, an analysis of the 4-hour time frame chart suggests that this correction may be forming a bullish continuation pattern known as a ‘flag’.
Also Read: Ripple And Whales Move 200 Mln XRP Amid Price Slump
XRP Price Prediction: Will $XRP Lose $0.6 Mark?
- Flag pattern formation for buyers an opportunity to replenish bullish momentum before the next leap
- The confluence of several chart levels at $0.6 creates a strong support zone
- The intraday trading volume in the XRP is $1.39 Million, indicating a 30% gain.
 Source: Tradingview
From mid-October and early November, XRP coin experienced significant growth, with its price increasing from $0.477 to a high of $0.732, marking a gain of 53.5%. Despite this positive trend, the recovery faced a reversal amid growing indecisiveness among investors.
Having said that, this correction in tandem with low volume is finding suitable support at the combined support of $0.6 and 50% Fibonacci retracement level. Such retracements are often viewed as beneficial for regenerating momentum and resuming an upward trend. Furthermore, the XRP price is currently confined within two downward-sloping trendlines, indicating the formation of a bullish flag pattern.
This pattern suggests that the coin price might breach the upper trendline, potentially propelling a recovery of up to 40%, targeting around $0.83.
However, this target level aligns with a long-standing trendline, which could act as a significant resistance and possibly hinder the recovery.
[converter id=”xrp-xrp” url=”https://coingape.com/price/converter/xrp-to-usd/?amount=1″]
Multi-Year Pattern Hints Sideways Trend Ahead
 Source: Tradingview
A look at the monthly time frame chart shows the XRP price has been resonating within the two converging trendlines of a symmetrical triangle pattern since 2018. The coin price reverted from both the upper and lower trendlines At least twice indicating the strong influence this pattern has on XRP. As the current recovery in this asset is poised to reach the upper trendline, the XRP price may face a huge surge in supply pressure which could trigger a fresh correction trend. Thus, Until this chart pattern is intact, the XRP price may prolong its sideways stretch.
- Bollinger Band: The Bollinger Band challenge on the downside reflects the selling momentum is active.
- Moving Average Convergence Divergence: A bearish crossover within the MACD and signal line highlights the ongoing correction trend.
Play 10,000+ Casino Games at BC Game with Ease
- Instant Deposits And Withdrawals
- Crypto Casino And Sports Betting
- Exclusive Bonuses And Rewards


Why Trust CoinGape
CoinGape has covered the cryptocurrency industry since 2017, aiming to provide informative insights Read more…to our readers. Our journal analysts bring years of experience in market analysis and blockchain technology to ensure factual accuracy and balanced reporting. By following our Editorial Policy, our writers verify every source, fact-check each story, rely on reputable sources, and attribute quotes and media correctly. We also follow a rigorous Review Methodology when evaluating exchanges and tools. From emerging blockchain projects and coin launches to industry events and technical developments, we cover all facets of the digital asset space with unwavering commitment to timely, relevant information.
24 Hours volume
$2.04B
Market Cap
$88.83B
Max Supply
100B


- CLARITY Act Negotiations Progress As Senators Meet With Trump’s Crypto Advisor
- Crypto Market Under Pressure as Traders Price Out Fed Rate Cuts Over Inflation Risks
- U.S.-Iran War: Iran Strikes Haifa Oil Refinery, Trump Urges Israel’s Restraint
- Bitcoin Crashes Below $70K as Analysts Warn Oil Could Hit $200 Amid U.S.-Iran Conflict
- Crypto Alert: Binance to Delist These Eight Tokens on April 1
- Crypto Stock to Watch As Bitcoin Price Crashed Below $70k; CRCL, COIN, MSTR, HOOD
- Why Is XRP Price Crashing Today (March 19th)
- Pi Network Price Forecast After PI Mainnet Upgrades To Protocol 20
- Will Bitcoin Price Hold $70K After Fed Reserve Keeps Rates Unchanged for 2nd Consecutive Meeting?
- Gold Price Crashed After U.S. Core PPI Came In Higher Than Expected.
- XRP Price Prediction 2026 Ahead of Major XRPL Technical Upgrades


