
XRP Price Prediction: Will $0.48 Support Hold or Break?


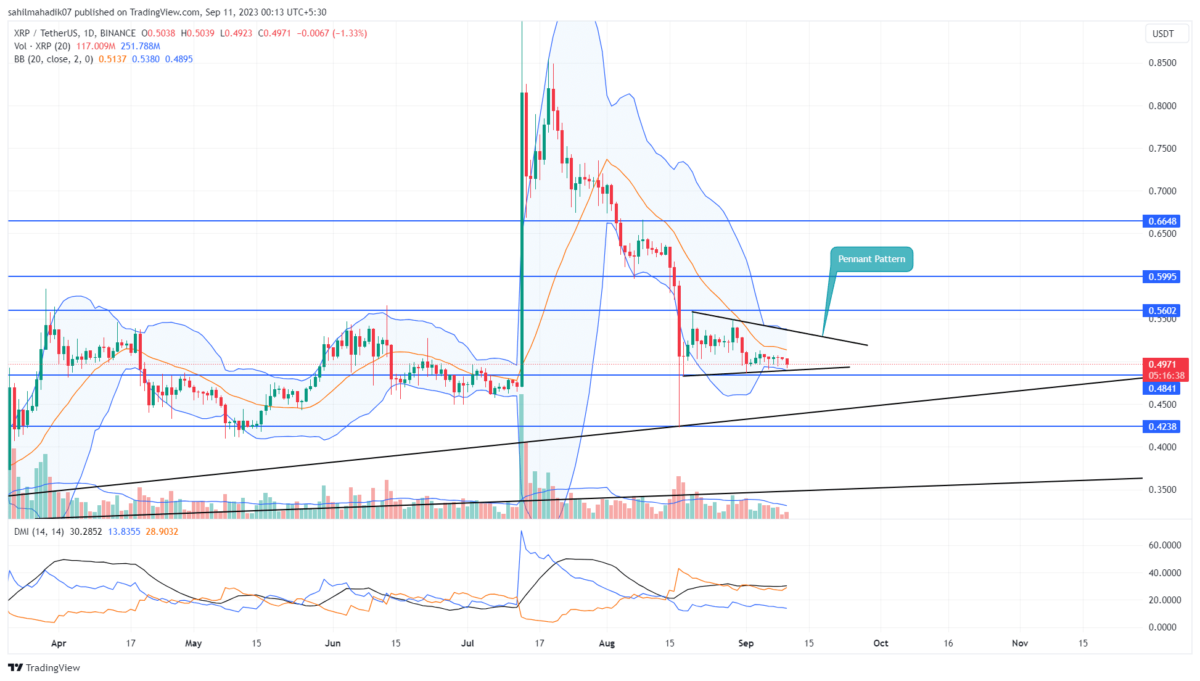
In the midst of prevailing crypto market uncertainty, the XRP price seems to have anchored itself near the $0.48 region. For the past three weeks, the coin price trajectory has been more horizontal than vertical, oscillating within a confined range dictated by two intersecting trend lines. This pattern, known by the trading analysis as a ‘ bearish pennant’, typically leans bearish in nature.
Also Read: XRP Holder’s Lawyer Reveals Regional Composition of Those He’s Representing
Bullish Reversal from Key Support Set a Quick 6% Jump
- The daily candle with lower price rejection indicates at the support trendline the demand pressure near $0.5 is intact
- A bearish breakdown from the triangle pattern will set the XRP price at 8.5%
- The intraday trading volume in the XRP is $454 Million, indicating a 9.6% gain
 Source: Tradingview
Over the past seven days, XRP price activity has been rather turbulent, constantly wavering above the triangle pattern’s support trendline. The daily chart reveals multiple short-bodied candles with minor price rejections, indicating the indecisive nature of market participants.
Nevertheless, patterns like these often see the price bounce off the support trendline, making its way upward to test the triangle’s upper boundary. With this behavior in mind, there’s potential for XRP to witness a 6% surge, possibly challenging the pennant’s resistance.
Yet, if we’re playing by the book, this pattern often concludes with a break below the lower trendline, potentially ushering XRP price towards the $0.45 mark, a possible decrease of 8.5%.
Will Buyers Rise Back to $0.6?
While bearish undertones color the current XRP narrative, it’s crucial to remember that as long as the pennant holds, the horizontal trend remains dominant. On a brighter note, should the price ascend beyond the triangle’s upper boundary, it could catalyze an influx of buyers, and surge a recovery to $0.6
- Bollinger Band: The narrow range of Bollinger Band indicators reflects the uncertain market trend.
- Directional Movement Index: A negative alignment between the DI+(blue) and DI-(orange) indicates the overall trend remains bearish.
Play 10,000+ Casino Games at BC Game with Ease
- Instant Deposits And Withdrawals
- Crypto Casino And Sports Betting
- Exclusive Bonuses And Rewards


Why Trust CoinGape
CoinGape has covered the cryptocurrency industry since 2017, aiming to provide informative insights Read more…to our readers. Our journal analysts bring years of experience in market analysis and blockchain technology to ensure factual accuracy and balanced reporting. By following our Editorial Policy, our writers verify every source, fact-check each story, rely on reputable sources, and attribute quotes and media correctly. We also follow a rigorous Review Methodology when evaluating exchanges and tools. From emerging blockchain projects and coin launches to industry events and technical developments, we cover all facets of the digital asset space with unwavering commitment to timely, relevant information.


- L2 Unity Launches 50M Token Airdrop Across Arbitrum and Optimism, Eligibility Open for 100K Wallets
- Tom Lee’s Bitmine Adds 5,000 ETH Despite $7.5B Unrealized Loss as BMNR Stock Rebounds
- CLARITY Act Should Ban Stablecoin Yields to Advance in Senate, French Hill Says
- U.S. Set to Deploy Warships to Keep the Strait of Hormuz Open, Bitcoin Climbs
- Crypto Market Retraces as Iran Vows to Escalate Conflict After U.S. Strikes on Kharg Island
- Official Trump Price Prediction As TRUMP Token Soars 50% Ahead Mar-a-Lago Invite Buzz for Top Holders
- Solana vs XRP Price Forecast: Can SOL Reclaim Its All-Time High Before XRP Hits $2?
- Top Analyst Predicts Cardano Price Could Surge 100% As Bitcoin Breaks $72k
- What’s Keeping Shiba Inu Below $0.0000065- Analyst Predicts 30% Rise Ahead
- Will BTC Price Rally to $100K by 2026? Kalshi and Polymarket Odds Climb to 51%
- Why Pi Network Price Surged 30% Today?


