XRP Price Prediction: Will the Ongoing Correction Hit $0.4?


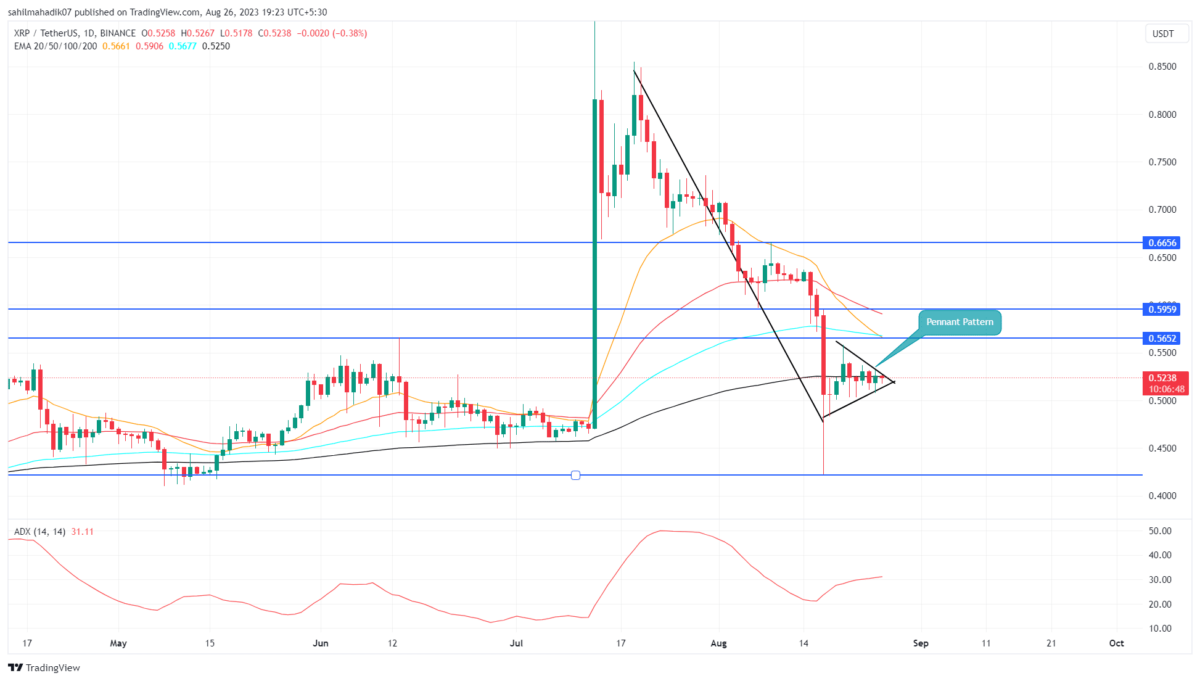
On August 17th, the XRP price printed a massive red candle on the daily time frame chart, recording a high and low of $0.5948 and $0.4226 respectively. Though this downfall triggered a notable negative sentiment among traders, the price action went sideways immediately. Thus, uncertainty could be associated with the choppy price behavior of the largest cryptocurrency, the XRP price has shaped into a bearish pennant pattern.
Also Read: Ripple Vs US SEC Trial No Earlier Than This Date, XRP Price Rebounds
XRP Daily Chart: Key Points
- The range between the triangle structure can be marked as a no-trading zone.
- A bearish crossover between the 20-and-100-day EMA may accelerate the supply pressure among market participants.
- The intraday trading volume in the XRP is 823.5 Million, indicating a 12.75% loss.
 Source: Tradingview`
In response to the indecisive market sentiment, the XRP price has been wavering sideways for over a week. A keen look at the 4-hour time frame chart shows the price action is confined in a narrow range within the two converging trendlines, forming a triangular shape.
After a massive downfall, this triangle setup indicates the formation of a bearish pennant pattern. By the press time, the XRP coin traded at $0.523 with an intraday loss of 0.51%.
Considering a higher possibility, the crypto sellers are likely to break the pattern’s lower support and accelerate the bearish momentum in price. The post-breakdown fall could plunge the altcoin’s market value by 18.8% revisiting the $0.422 low.
[converter id=”xrp-xrp” url=”https://coingape.com/price/converter/xrp-to-usd/?amount=1″]
Can XRP Buyer Make a Comeback?
While the overall market sentiment and price behavior support sellers, buyers may get an opportunity to counterattack if they break the upper trendline of the pattern. A bullish breakout from the overhead trendline will intensify bullish momentum and prepare a significant upswing in XRP price. However, the anticipated recovery must close above the August 17th high of $0.5948 for better confirmation.
- Exponential Moving Average: The 20-day EMA slope may offer dynamic resistance against the bullish bounce
- Average Directional Index: An uptick in the daily ADX slope at 31% indicates sellers can carry further downfall.

Why Trust CoinGape
CoinGape has covered the cryptocurrency industry since 2017, aiming to provide informative insights Read more…to our readers. Our journal analysts bring years of experience in market analysis and blockchain technology to ensure factual accuracy and balanced reporting. By following our Editorial Policy, our writers verify every source, fact-check each story, rely on reputable sources, and attribute quotes and media correctly. We also follow a rigorous Review Methodology when evaluating exchanges and tools. From emerging blockchain projects and coin launches to industry events and technical developments, we cover all facets of the digital asset space with unwavering commitment to timely, relevant information.

Related Articles


- Breaking: Michael Saylor’s Strategy Makes 100th Bitcoin Purchase, Buys 592 BTC as Market Struggles
- Satoshi-Era Whale Dumps $750M BTC as Hedge Funds Pull Out Billions in Bitcoin
- XRP Sees Largest Realized Loss Since 2022, History Points to Bullish Price Run: Report
- US Strike on Iran Possible Within Hours: Crypto Market on High Alert
- MetaSpace Will Take Its Top Web3 Gamers to Free Dubai Trip
- Top 3 Meme Coins Price Prediction As BTC Crashes Below $67k
- Top 4 Reasons Why Bitcoin Price Will Crash to $60k This Week
- COIN Stock Price Prediction: Will Coinbase Crash or Rally in Feb 2026?
- Shiba Inu Price Feb 2026: Will SHIB Rise Soon?
- Pi Network Price Prediction: How High Can Pi Coin Go?
- Dogecoin Price Prediction Feb 2026: Will DOGE Break $0.20 This month?


