 Buy $GGs
XRP Price Prediction: Will Range Pattern Breakout Push $XRP Above $0.6?


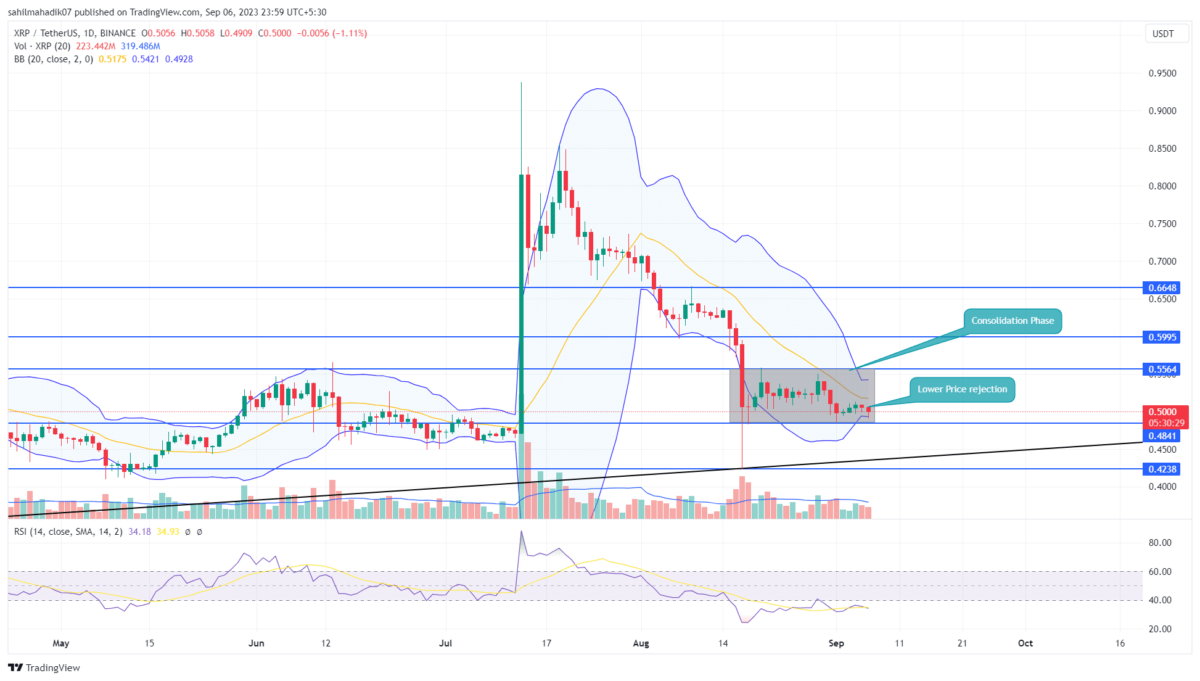
For nearly three weeks, the XRP coin price has walked a lateral path, reflecting the indecisive nature among market participants. This sideways action confined with two horizontal levels of $0.556 and $0.486 indicates the formation of a narrow range/rectangle pattern in the daily chart. Here’s how interested traders may use this setup to trade XRP.
Also Read: XRP Price Prediction: XRP Risks Downside Thrust, Sellers Growing Stronger?
Range Breakout will Trigger a Directional Move
- The range pattern formation creates a no-trading zone for XRP traders
- A bullish breakout from $0.556 resistance may surge the coin price by 20%
- The intraday trading volume in the XRP is $759.5 Million, indicating a 4.3% loss.
 Source: Tradingview
The XRP price has been in a correction phase for the past two months. From the last swing high of $0.936 and coin price tumbled nearly 48% to reach the current trader’s price of $498. However, in response to broader market uncertainty the coin price has been consolidating since mid-August.
During the sideways action, the coin price rebounded twice from the upper resistance of $0.556 and lower support of 0.486. With an intraday loss of 1.24%, the sellers retested the bottom support, only to face intact demand pressure evidenced by the lower price rejection candle.
Therefore, a potential rebound from the bottom footing will encourage buyers to bullish swing and break above $0.556. This breakout will accelerate the buying pressure and likely surge to $0.665.
[converter id=”xrp-xrp” url=”https://coingape.com/price/converter/xrp-to-usd/?amount=1″]
Can the XRP Price Fall Back to $0.42?
Amid an established downtrend, the asset price usually creates such short consolidation to recuperate the exhausted bearish momentum and prolong the downward march. Therefore, the XRP price is more likely to pierce the $0.486 support. This crackdown will release the build-up momentum to push the coin price 13% down to hit $0.42.
- Bollinger Bands: The narrow range of the Bollinger Band indicator reflect uncertainty among traders
- Relative Strength Index: The RSI slope reflects the underlying buying pressure is rising
Play 10,000+ Casino Games at BC Game with Ease
- Instant Deposits And Withdrawals
- Crypto Casino And Sports Betting
- Exclusive Bonuses And Rewards


Why Trust CoinGape
CoinGape has covered the cryptocurrency industry since 2017, aiming to provide informative insights Read more…to our readers. Our journal analysts bring years of experience in market analysis and blockchain technology to ensure factual accuracy and balanced reporting. By following our Editorial Policy, our writers verify every source, fact-check each story, rely on reputable sources, and attribute quotes and media correctly. We also follow a rigorous Review Methodology when evaluating exchanges and tools. From emerging blockchain projects and coin launches to industry events and technical developments, we cover all facets of the digital asset space with unwavering commitment to timely, relevant information.

Related Articles


- Crypto News: Bitcoin Sell-Off Fears Rise as War Threatens Iran’s BTC Mining Operations
- U.S.–Iran War: Monday Crypto Crash Odds Rise As Pundits Predict Oil Price Spike
- US-Iran War: Reports Confirm Bombings In UAE, Bahrain and Kuwait As Crypto Market Makes Recovery
- XRP Price Dips on US-Iran Conflict, But Capitulation Signals March Rebound
- Crypto Market at Risk as U.S.–Iran War Threatens Inflation With Oil Price Surge
- Circle (CRCL) Stock Price Prediction as Today is the CLARITY Act Deadline
- Analysts Predict Where XRP Price Could Close This Week – March 2026
- Top Analyst Predicts Pi Network Price Bottom, Flags Key Catalysts
- Will Ethereum Price Hold $1,900 Level After Five Weeks of $563M ETF Selling?
- Top 2 Price Predictions Ethereum and Solana Ahead of March 1 Clarity Act Stablecoin Deadline
- Pi Network Price Prediction Ahead of Protocol Upgrades Deadline on March 1


