 Buy $GGs
XRP Price Prediction: Will $XRP Lose $0.5 Mark In September?


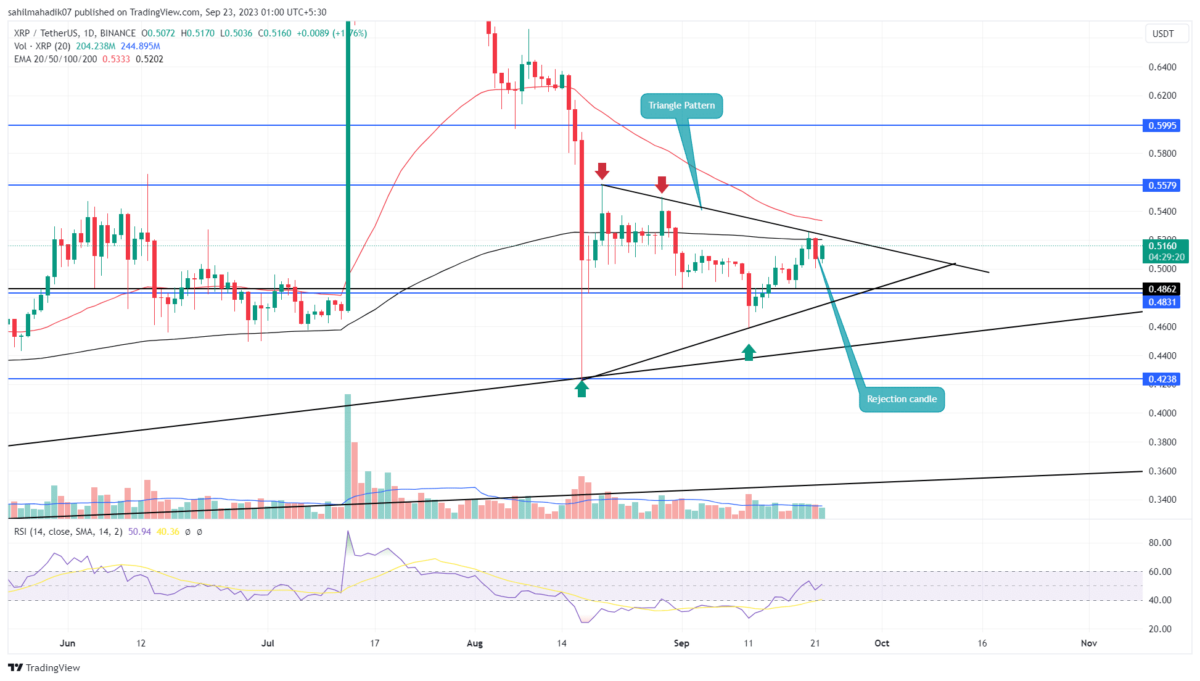
Over the past fortnight, the XRP price value surged notably, leaping from $0.4592 to touch the $0.52 mark. This rise translated to a 14.5% increase but remained restrained within the boundaries of a symmetrical triangle pattern. This pattern has played a pivotal role in dictating altcoin’s price movement for the last month, suggesting its continued influence in the foreseeable future.
Also Read: Whale Moves 120 Mln XRP From Bithumb, Bull Run Ahead?
XRP Price To Retest $0.55
- A breakout from either side of the triangle pattern could trigger a directional rally.
- The upper trendline may surge the price to $0.55
- The intraday trading volume in the XRP is $715 Million, indicating a 29% loss
 Source: Tradingview
As the broader crypto market exhibited bearish tendencies, the XRP price couldn’t sustain its uptrend, faltering at the $0.525 resistance. This pullback marks the third time the price has recoiled from the triangle’s upper trendline, underscoring the pattern’s dominance over this asset.
The daily charts further substantiate this bearish sentiment by revealing an ‘Evening Star’ pattern at the resistance, a classic precursor to potential downtrends. If sellers continue to dominate the market, the XRP price might decline by around 6%, pushing its price down to the $0.485 level, thus retesting the triangle’s lower boundary.
As long as XRP oscillates between these trendlines, its price might remain range-bound.
Is $0.45 Next?
Historically, symmetrical triangles are viewed as continuation patterns. Given the trend and Epattern dynamics, it seems XRP might lean towards breaching the triangle’s lower support. Should this breach transpire, the amplified selling pressure could push the coin price further down towards the $0.45 support, with the subsequent target being the $0.42 level.
Play 10,000+ Casino Games at BC Game with Ease
- Instant Deposits And Withdrawals
- Crypto Casino And Sports Betting
- Exclusive Bonuses And Rewards


Why Trust CoinGape
CoinGape has covered the cryptocurrency industry since 2017, aiming to provide informative insights Read more…to our readers. Our journal analysts bring years of experience in market analysis and blockchain technology to ensure factual accuracy and balanced reporting. By following our Editorial Policy, our writers verify every source, fact-check each story, rely on reputable sources, and attribute quotes and media correctly. We also follow a rigorous Review Methodology when evaluating exchanges and tools. From emerging blockchain projects and coin launches to industry events and technical developments, we cover all facets of the digital asset space with unwavering commitment to timely, relevant information.

Related Articles


- Indiana Signs Bitcoin Bill Into Law Allowing Crypto in Retirement Plans
- ‘Time to Act Is Now’: CFTC Chief Pushes Swift Passage of CLARITY Act
- Trump Tells Congress to Pass Crypto Market Bill ‘ASAP,’ Blasts Banks for Stalling
- BTC Price Bounces as Spot Investors Buy The Dip Amid Iran War Jitters
- CFTC Chief Mike Selig Signals US Crypto Perpetual Futures Rollout in Coming Weeks
- Gold Price Prediction March 2026: Rally, Crash, or Record Highs?
- RIOT Stock Prediction as Needham, Piper Sandler Slash Target After Earnings
- Cardano Price Outlook As Charles Hoskinson Warns Over CLARITY Act
- Circle Stock Price Climbs 15% to $96, Can Rally Continue in March 2026?
- Bitcoin Price Prediction as US-Iran War Enters 4th Consecutive Day
- Top 5 Historical Reasons Dogecoin Price Is Not Rising


