 Buy $GGs
XRP Price Prediction: Will $XRP Regain $1 by 2023 End?


XRP Price Prediction: Amid the Bitcoin price retracement towards the $36,000 level, the XRP price has dipped to re-examine the $0.64 zone, which is deemed a key demand area. The digital currency presently hovers within a certain supply threshold, yet there’s an anticipation of an upward trajectory post the SEC litigation’s final decision.
Also Read: Judge Analisa Torres Signs Order On Remedies Discovery And Briefing
Should you Enter at $0.65 Dip?
- A minor pullback to $0.65 could recuperate the exhausted bullish momentum.
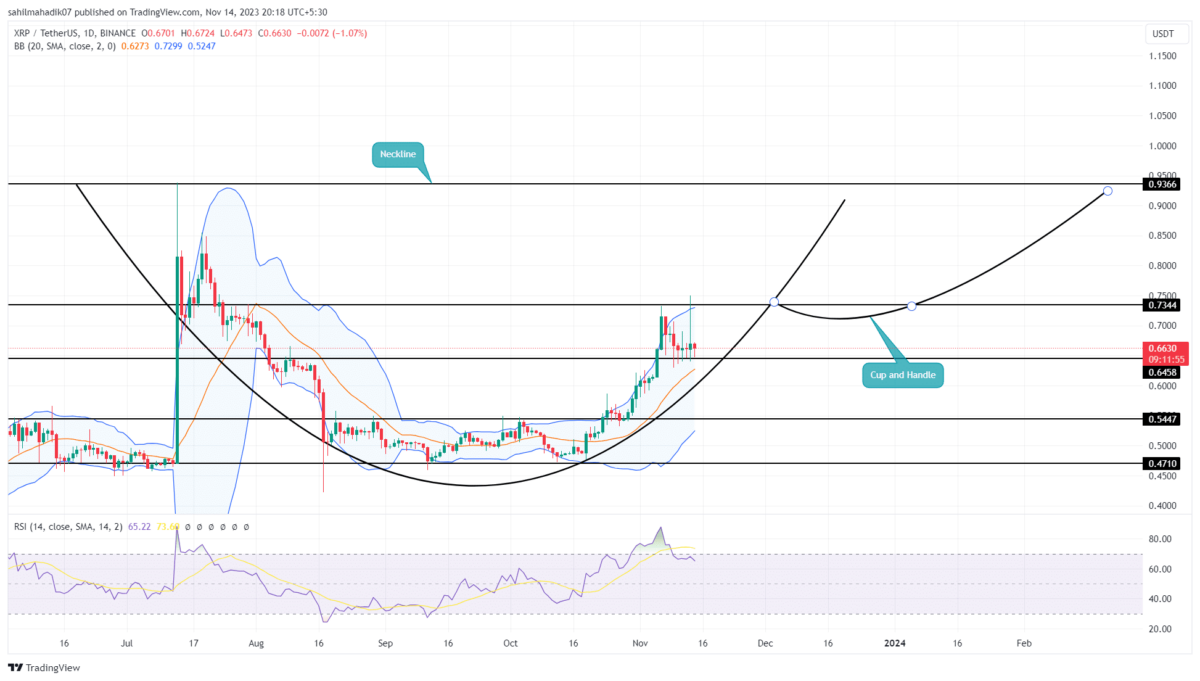
- Under the influence of the cup and handle pattern bullish recovery pattern, the coin price should rise to $0.93 resistance for a bullish breakout.
- The intraday trading volume in the XRP is $3.5 Billion, indicating a 242% gain.
 Source- Tradingview
Following a bullish reversal from the $0.46 level, the XRP price witnessed a recovery rally to $0.75, fueled by swift progress in the SEC lawsuit and a broader market resurgence.
The price reclaiming the $0.65 level has prompted a re-evaluation phase, characterized by several Doji candles in the previous week. However, buyers are retaining control of the trend, hinting at a cup and handle pattern on the daily chart. This bullish reversal pattern gives a clear transition from downtrend to uptrend as an asset witnesses bottom accumulation.
The XRP is currently priced at $0.66, drawing support from the $0.65 zone, though it has seen a minor daily decrease of 0.96%. The pullback diminishing trajectory suggests a dampening of selling pressure and hints at a potential bullish reversal.
Potential to Hit $1?
As the market’s rebound takes a brief pause, the XRP price exhibits signs of optimism, notably through the ‘cup and handle’ pattern. The presence of Doji candles at the $0.65 benchmark suggests a forthcoming bullish pivot for this altcoin price.
Should the recovery rally surpass the $0.75 threshold and maintain the bullish pattern, the surge could extend to the $1 mark.
Conversely, a fall below $0.65 may precipitate a decline to the $0.52 level.
- Bollinger band: An upswing in the upper boundary of the Bollinger band reflects the bullish momentum is still active.
- Relative Strength Index: The RSI slope has momentarily dipped below the overbought territory, aligning with a lateral movement trend. Nonetheless, at 66%, this indicator still projects a strong bullish bias.
Play 10,000+ Casino Games at BC Game with Ease
- Instant Deposits And Withdrawals
- Crypto Casino And Sports Betting
- Exclusive Bonuses And Rewards


Why Trust CoinGape
CoinGape has covered the cryptocurrency industry since 2017, aiming to provide informative insights Read more…to our readers. Our journal analysts bring years of experience in market analysis and blockchain technology to ensure factual accuracy and balanced reporting. By following our Editorial Policy, our writers verify every source, fact-check each story, rely on reputable sources, and attribute quotes and media correctly. We also follow a rigorous Review Methodology when evaluating exchanges and tools. From emerging blockchain projects and coin launches to industry events and technical developments, we cover all facets of the digital asset space with unwavering commitment to timely, relevant information.
24 Hours volume
$3.08B
Market Cap
$87.18B
Max Supply
100B

Related Articles


- Bitget Unveils Upgrade For Stock, Gold Trading Alongside Crypto As Part Of Universal Exchange Push
- ChangeNOW Is Settling Crypto Swaps in Under a Minute.
- $3B Western Union Expands Into Crypto With USDPT Stablecoin Launch on Solana
- XRP News: Key Ripple Whale Indicator Turns Bullish After Months, Price Rally Ahead?
- Crypto Market Today: BTC, ETH, XRP, SOL, and DOGE Rally as Geopolitical Tensions Ease
- Pi Network Price As BTC Rallies Above $74K: Can PI Coin Extend Gains to $0.30?
- XRP Price As Bitcoin Reclaims $74K- Is $5 Next?
- Dogecoin Price Outlook as BTC Recovers Above $73,000
- XRP Price Prediction as Iran-U.S. Peace Talks Trigger a Crypto Rally
- COIN Stock Analysis as Bitcoin Retests $72k Ahead of February NFP Data
- Robinhood Stock Price Prediction As Cathie Wood Buys $12M Dip in Bold ARK Move


