XRP Price Rare Pattern Points to a Surge to $3 as ETFs Cross $1B Milestone


Highlights
- XRP price has formed a highly bullish chart pattern on the daily chart.
- The coin has had substantial ETF inflows in the past few weeks.
- The cumulative XRP ETF inflows rose to $1 billion this week.
XRP price dropped by 1.2% today, Dec. 17, continuing a downward trend that started in July when it jumped to a record high of $3.6575. This crash could be about to end as the token has formed a rare bullish pattern that may drive it to $3 as ETF inflows jump.
XRP Price May Benefit From the Ongoing ETF Inflows
One potential driver that may push the XRP price higher in the coming weeks is the fact that it is in an accumulation phase.
Data compiled by SoSoValue shows that spot XRP ETFs, which were launched last month, have become highly popular among investors.
Ripple ETFs have crossed the $1 billion inflow milestone, a notable achievement considering that all Ethereum funds took over a month to reach that amount.
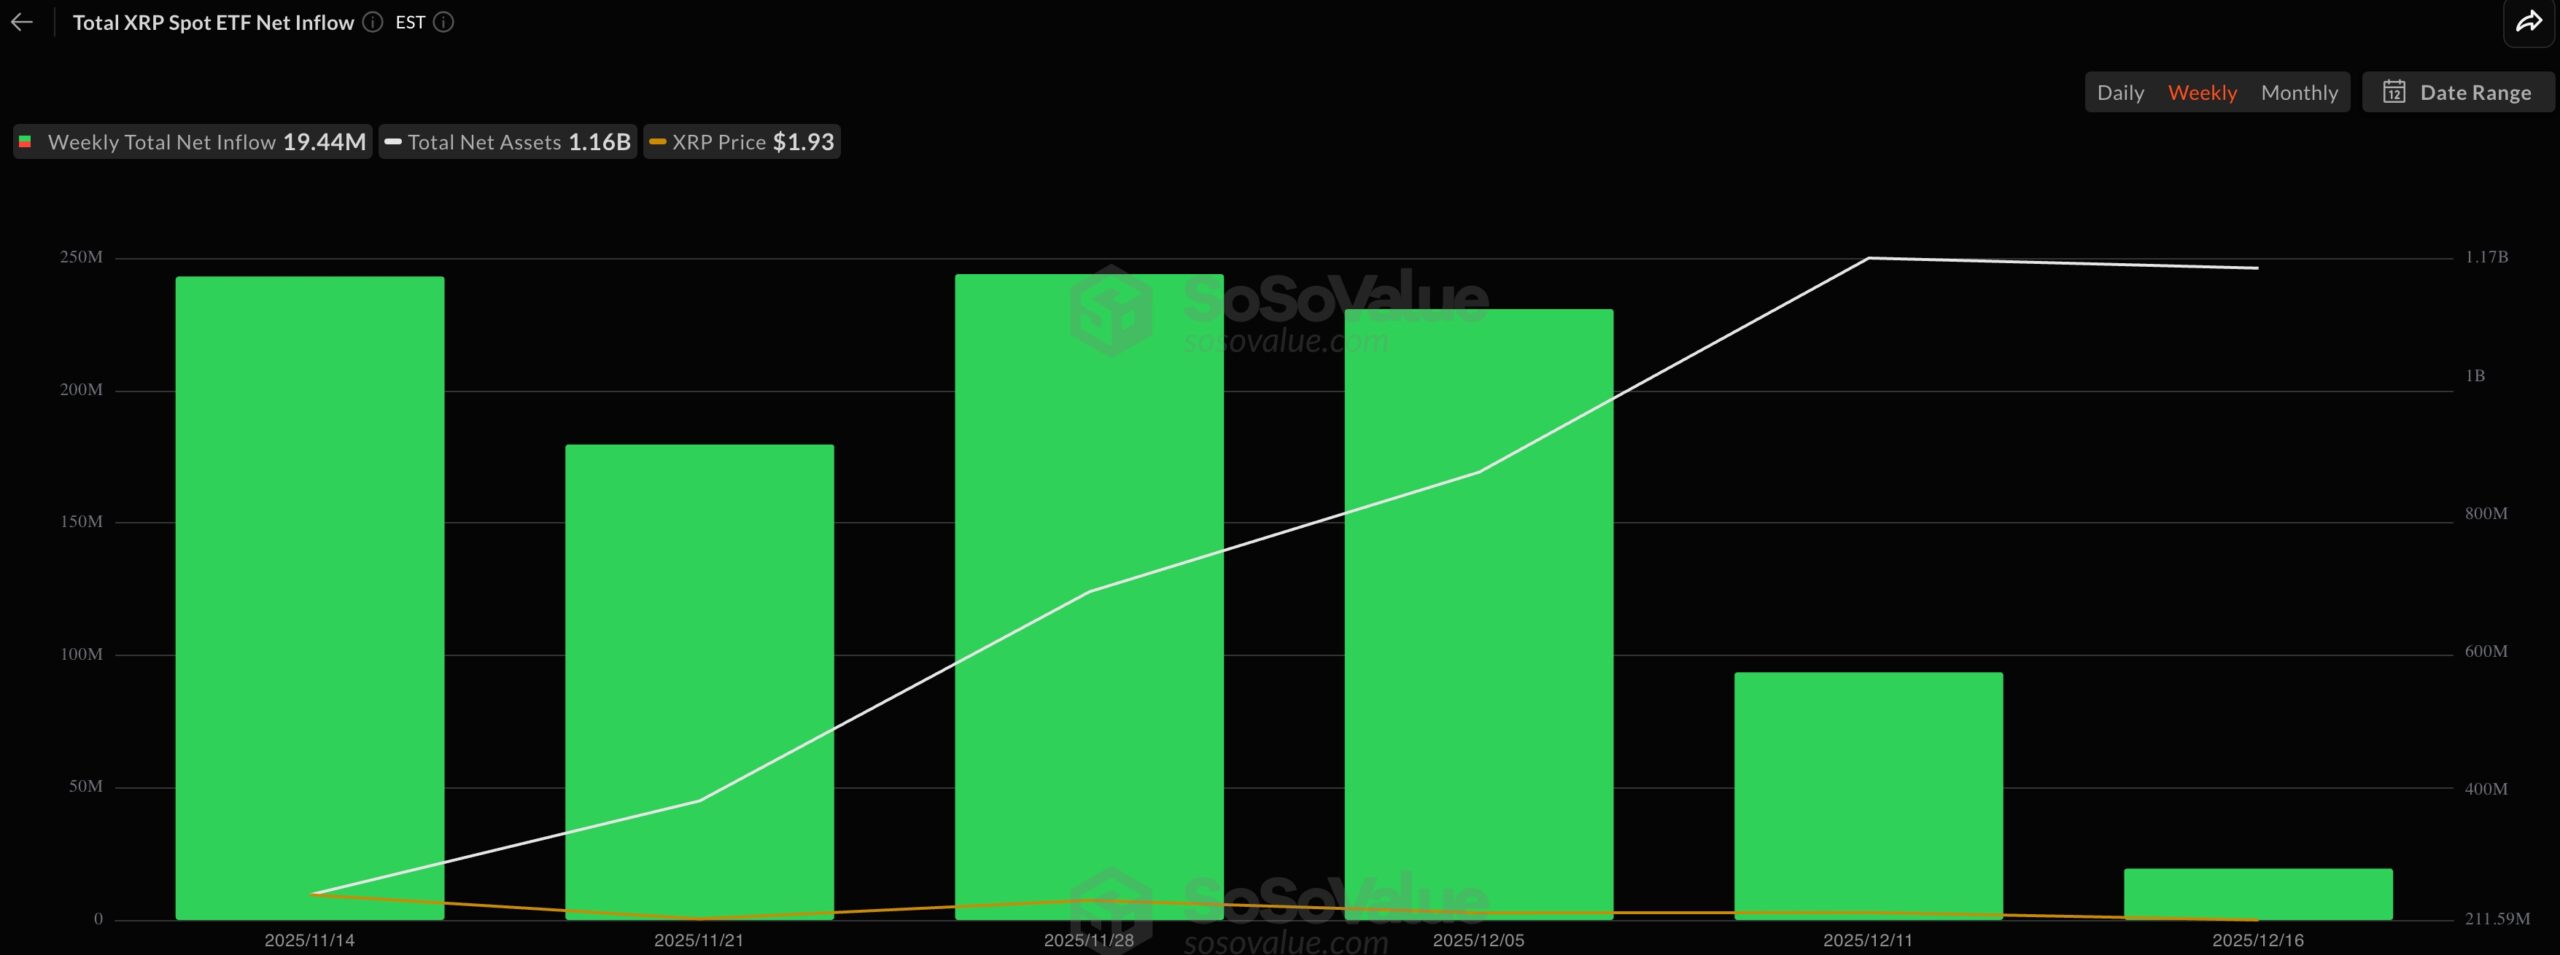
Most importantly, the XRP ETFs have never had a day without inflows, with their worst day being on November 18 when they received $8.2 million in inflows.
There are odds that these ETFs will continue to gain assets in the coming months as JPMorgan predicted that they would achieve between $6 billion and $8 billion in inflows in the first year. As such, if the trend continues, there is a likelihood that the funds will surpass that prediction.
The ongoing XRP ETF inflows is also notable because it is happening as investors dump their Bitcoin and Ethereum funds. Spot Bitcoin ETFs had over $277 million in outflows on Tuesday after shedding $357 million on the previous day. These funds have shed billions in assets in the past few months.
Similarly, Ethereum ETFs have shed over $500 million in assets in the last four days, bringing the cumulative net inflows to $12.6 billion, down from the all-time high of nearly $15 billion. As such, there are signs of a potential rotation from Bitcoin and Ethereum to XRP funds.
XRP Price Technical Analysis
The daily chart shows that the XRP price has been in a steep sell-off in the past few months as demand waned and the crypto market crash continued.
Most technical indicators suggest that the coin has more downside to go. For example, Ripple price remains below all moving averages, while oscillators like the Relative Strength Index and the Percentage Price Oscillator have pointed downwards.
However, a keener look shows that the token has formed an inverted head-and-shoulders pattern whose neckline connects the highest swings since October 2. It is now in the right shoulder stage.
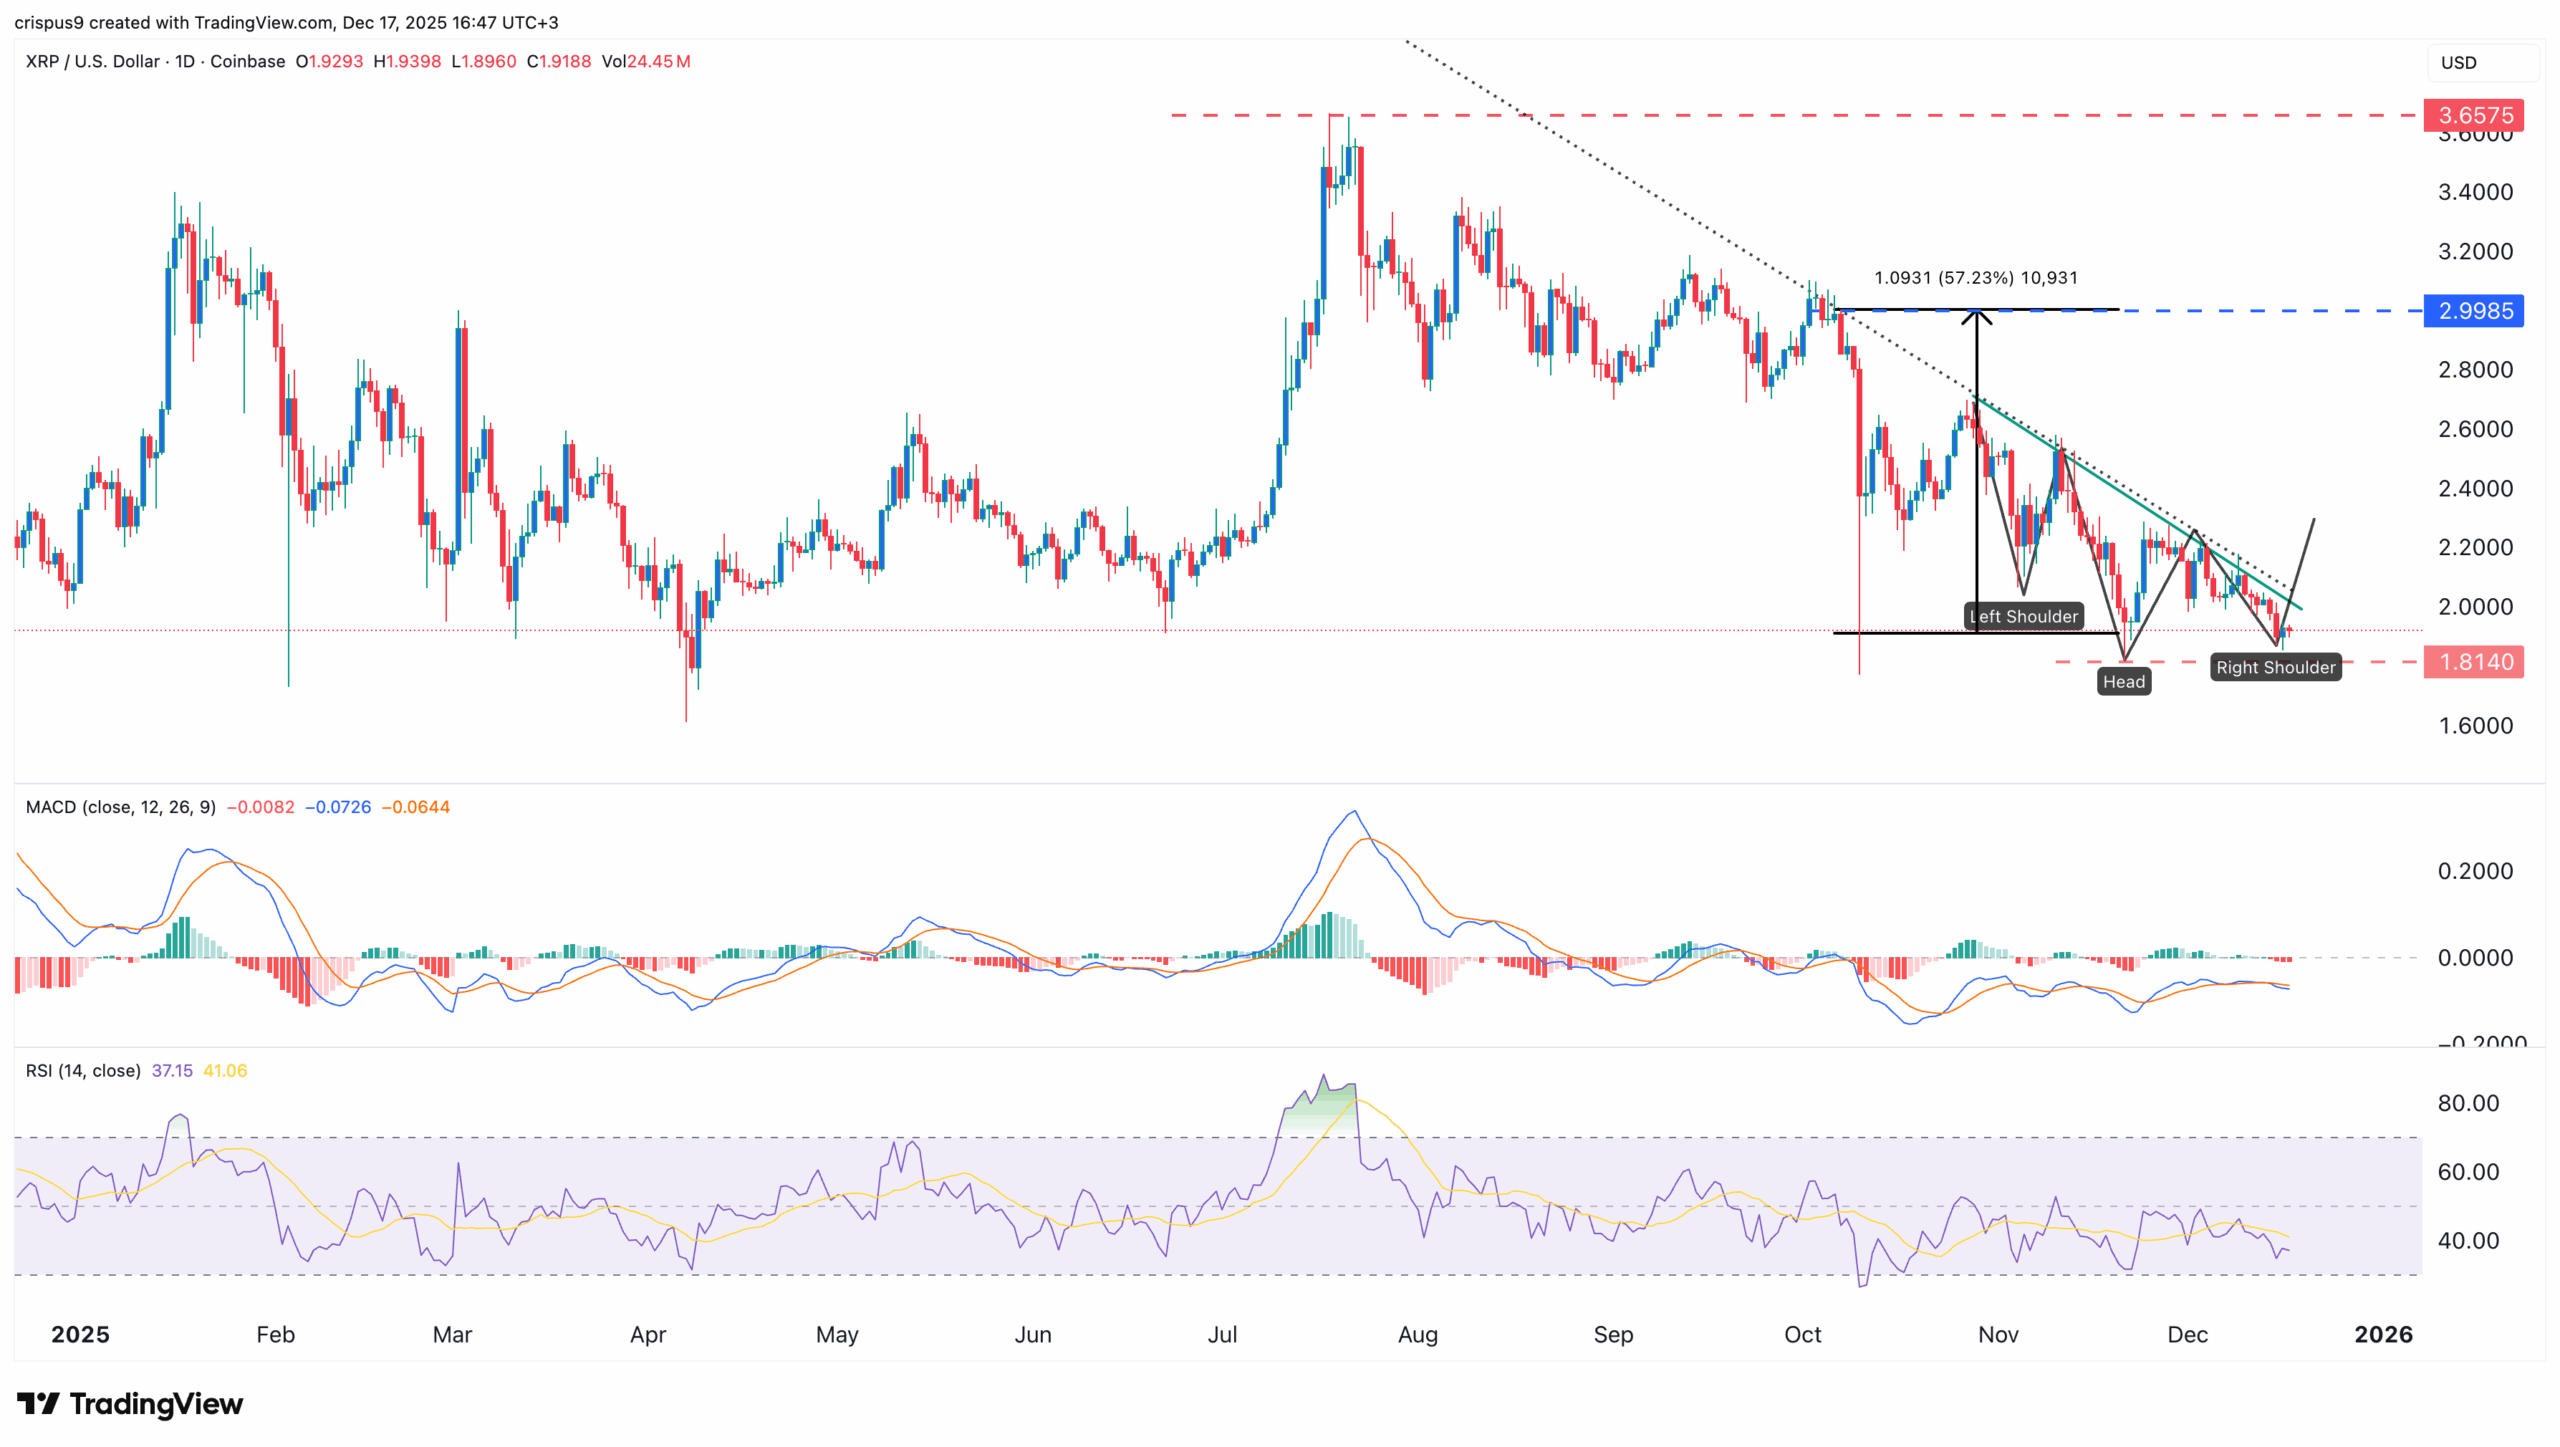
Also, the token has formed a double-bottom pattern at $1.8140. Therefore, the most likely XRP price forecast is where it rebounds and moves to the psychological level at $3, which is 57% above the current level.
On the flip side, a drop below the important support level at $1.8140 will invalidate the bullish forecast.
Frequently Asked Questions (FAQs)
1. What is the most likely XRP price forecast?
2. What is the main catalyst for the Ripple price?
3. Is XRP a good coin to buy today?

Why Trust CoinGape
CoinGape has covered the cryptocurrency industry since 2017, aiming to provide informative insights Read more…to our readers. Our journal analysts bring years of experience in market analysis and blockchain technology to ensure factual accuracy and balanced reporting. By following our Editorial Policy, our writers verify every source, fact-check each story, rely on reputable sources, and attribute quotes and media correctly. We also follow a rigorous Review Methodology when evaluating exchanges and tools. From emerging blockchain projects and coin launches to industry events and technical developments, we cover all facets of the digital asset space with unwavering commitment to timely, relevant information.
24 Hours volume
$1.63B
Market Cap
$83.17B
Max Supply
100B