 Buy $GGs
XRP Price Regains Bullish Momentum; Time to Surpass $1?


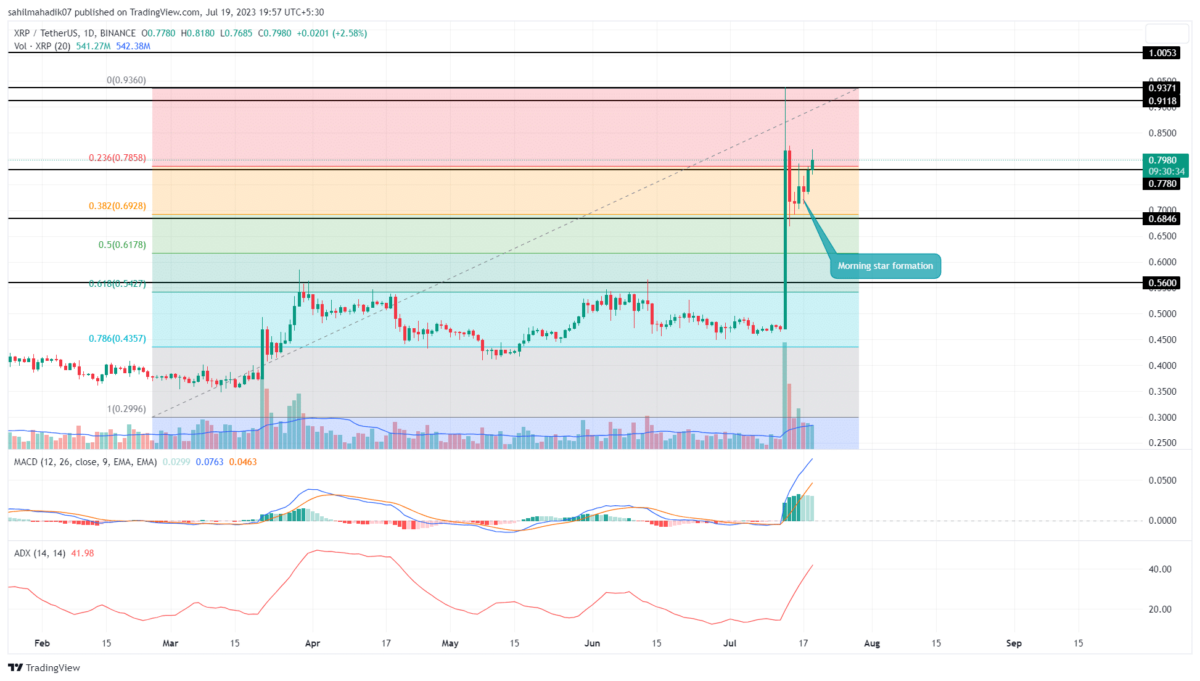
After a massive jump on July 13th, the XRP price witnessed a minor correction starting from the $0.937 high. This bearish pullback tumbled the prices 36.7% but found immediate support at the 38.2% Fibonacci retracement level. This FIB level aligned with $0.68 support created a strong demand pressure and replenished the exhausted bullish momentum for further rally. Can this post-correction rally push the XRP price above $1?
Also Read: XRP Price Looks Beyond $1, Analyst Predicts Groundbreaking Rally To $27
XRP Price Daily Chart:
- The $0.937 stands as crucial resistance against coin buyers
- Post-correction rally hints 16.6% rally to hit $0.911 resistances
- The intraday trading volume in the XRP is $3.2 Billion, indicating a 29% gain.
 Source: Tradingview
On July 16th, the XRP price rebounded from the 38.2% FIB level with a bullish reversal morning star candle pattern. A correction to the aforementioned retracement level is considered healthy to recuperate exhausted bullish momentum and lead a long-term bull trend.
In the last five days, the coin price surged 15% and breached the immediate resistance of $0.778 near the 23.6% FIB level. As of now, the XRP price trades at $0.8, and if the daily candle closes above the reclaimed resistance, the buyers will gain additional support to prolong to $0.937 swing high.
The $0.937 resistance is crucial for the crypto buyers, as a breakout above will give suitable confirmation for uptrend continuation above $1.
[converter id=”xrp-xrp” url=”https://coingape.com/price/converter/xrp-to-usd/?amount=1″]
Will XRP Price Reclaim $1 Milestone?
If the market conditions remain uncertain, rejection signs at $0.937 resistance will reflect the possibility of a bearish reversal pattern called a double top. The pattern formation could undermine the bullish thesis and trigger significant correction below the $0.68 support.
- Moving average convergence divergence: A significance spread between the MACD(Blue) and signal line(orange) in a bull crossover state indicates a bullish uptrend is intact.
- Average Directional Index: The high value of the daily ADX slope(42%) indicates instability in the current bullish trend.
Play 10,000+ Casino Games at BC Game with Ease
- Instant Deposits And Withdrawals
- Crypto Casino And Sports Betting
- Exclusive Bonuses And Rewards


Why Trust CoinGape
CoinGape has covered the cryptocurrency industry since 2017, aiming to provide informative insights Read more…to our readers. Our journal analysts bring years of experience in market analysis and blockchain technology to ensure factual accuracy and balanced reporting. By following our Editorial Policy, our writers verify every source, fact-check each story, rely on reputable sources, and attribute quotes and media correctly. We also follow a rigorous Review Methodology when evaluating exchanges and tools. From emerging blockchain projects and coin launches to industry events and technical developments, we cover all facets of the digital asset space with unwavering commitment to timely, relevant information.

Related Articles


- Is World War III Near? Bitcoin Price Drops As UK, France, Germany Consider Iran Action
- Is Bitcoin Dead? Here’s What the Data Really Says
- US-Iran War: Meme Coin Market Plunges After Iranian Drone Hits US Embassy in Kuwait
- Arthur Hayes Sees 5x HYPE Token Rally as Oil Perps Pump on Hyperliquid Amid U.S.–Iran War
- How BTC, ETH and XRP Prices React as Crude Oil and Safe Havens Surge After Khamenei’s Death
- Bitcoin And XRP Price As US Kills Iran Supreme Leader- Is A Crypto Crash Ahead?
- Gold Price Prediction 2026: Analysts Expect Gold to Reach $6,300 This Year
- Circle (CRCL) Stock Price Prediction as Today is the CLARITY Act Deadline
- Analysts Predict Where XRP Price Could Close This Week – March 2026
- Top Analyst Predicts Pi Network Price Bottom, Flags Key Catalysts
- Will Ethereum Price Hold $1,900 Level After Five Weeks of $563M ETF Selling?


