XRP Price Wavers in Make-or-Break Situation; What’s Next $0.55 or $0.4?


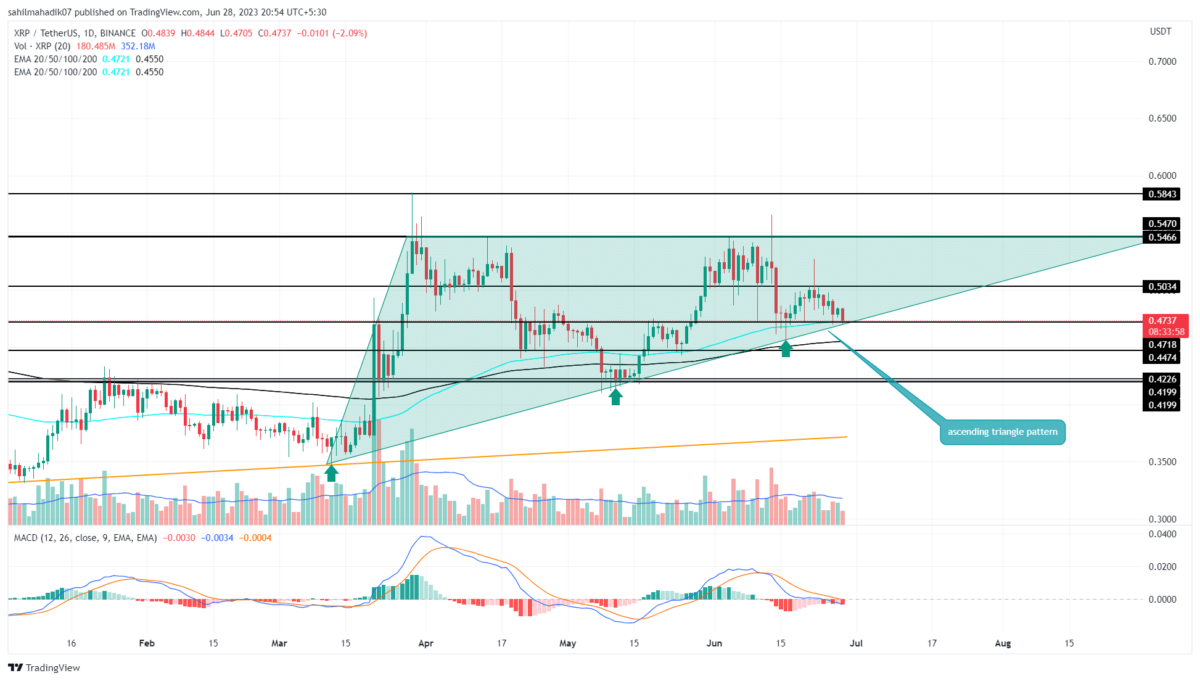
The XRP coin has remained an underperforming crypto asset throughout June. Even the minor recovery witnessed during this month’s third week has evaporated and the coin’s market value plunged back to the $0.474 mark. However, a look at the longer time frame chart reflects that buyers are respecting an ascending support trendline of a bullish continuation pattern called ascending triangle.
Also Read: Why July Is Crucial For Ripple Vs SEC Lawsuit, XRP Price & Overall Crypto Market?
XRP Price Daily Chart:
- A retest to the ascending support could replenish the bullish momentum.
- The 100-day EMA slope offers dynamic support to the XRP price
- The intraday trading volume in the XRP is $818.3 Million, indicating a 10.8% loss.
 Source- Tradingview
With an intraday loss of 2.36%, the XRP price plunged back to the long-coming support trendline. The coin price has already bounced from this support thrice indicating buyers are accumulating this coin at dips.
If the coin price manages to sustain this support, the market participants can expect another reversal. Each reversal creates a new higher low, where the buyers get closer to the overhead resistance of $0.55 and increased the potential of a bullish breakout.
This anticipated reversal could drive the XRP price to the $0.5 mark, followed by $0.55.
What If XRP Price Breaks Support Trendline?
The rising trendline within the triangle pattern has played a crucial role in sustaining the upward momentum of XRP’s price over the last 100 days. However, the growing supply pressure in the market raises concerns. Should the price break below the ascending trendline, it would undermine the bullish outlook. Consequently, this could trigger a significant sell-off, leading to a potential 10% decline in XRP, with a target price of $0.4.
- Exponential Moving Average: The XRP price above the 100-and-200-day EMA slope reflects the overall trend remains bullish.
- Moving Average Convergence Divergence: A possible breakdown of MACD(Blue) and signal(orange) below the neutral line could increase the selling momentum in XRP Price.

Why Trust CoinGape
CoinGape has covered the cryptocurrency industry since 2017, aiming to provide informative insights Read more…to our readers. Our journal analysts bring years of experience in market analysis and blockchain technology to ensure factual accuracy and balanced reporting. By following our Editorial Policy, our writers verify every source, fact-check each story, rely on reputable sources, and attribute quotes and media correctly. We also follow a rigorous Review Methodology when evaluating exchanges and tools. From emerging blockchain projects and coin launches to industry events and technical developments, we cover all facets of the digital asset space with unwavering commitment to timely, relevant information.

Related Articles


- Top 3 Reasons Why Crypto Market is Down Today (Feb. 22)
- Michael Saylor Hints at Another Strategy BTC Buy as Bitcoin Drops Below $68K
- Expert Says Bitcoin Now in ‘Stage 4’ Bear Market Phase, Warns BTC May Hit 35K to 45K Zone
- Bitcoin Price Today As Bulls Defend $65K–$66K Zone Amid Geopolitics and Tariffs Tensions
- XRP Realized Losses Spike to Highest Level Since 2022, Will Price Rally Again?
- COIN Stock Price Prediction: Will Coinbase Crash or Rally in Feb 2026?
- Shiba Inu Price Feb 2026: Will SHIB Rise Soon?
- Pi Network Price Prediction: How High Can Pi Coin Go?
- Dogecoin Price Prediction Feb 2026: Will DOGE Break $0.20 This month?
- XRP Price Prediction As SBI Introduces Tokenized Bonds With Crypto Rewards
- Ethereum Price Rises After SCOTUS Ruling: Here’s Why a Drop to $1,500 is Possible


