 Buy $GGs
Zilliqa Price Prediction: ZIL Price Zooms 10%; Is $0.16 Possible?


ZIL price trades higher with significant gains amid sustained buying pressure. The price extends the gains for the second straight session in a row after bottoming out near $0.10. A successful breakout above the upper resistance could yield further gains in the asset.
- ZIL price prints handsome gains on Thursday in a quite broader crypto market.
- Expect more gains if the price break above $0.14 on the daily basis.
- The downside is capped near the 50-day EMA at $0.91.
As of writing, ZIL/USD is exchanging hands at $0.12, up 11.12% so far.
ZIL price set up the bullish trading frame
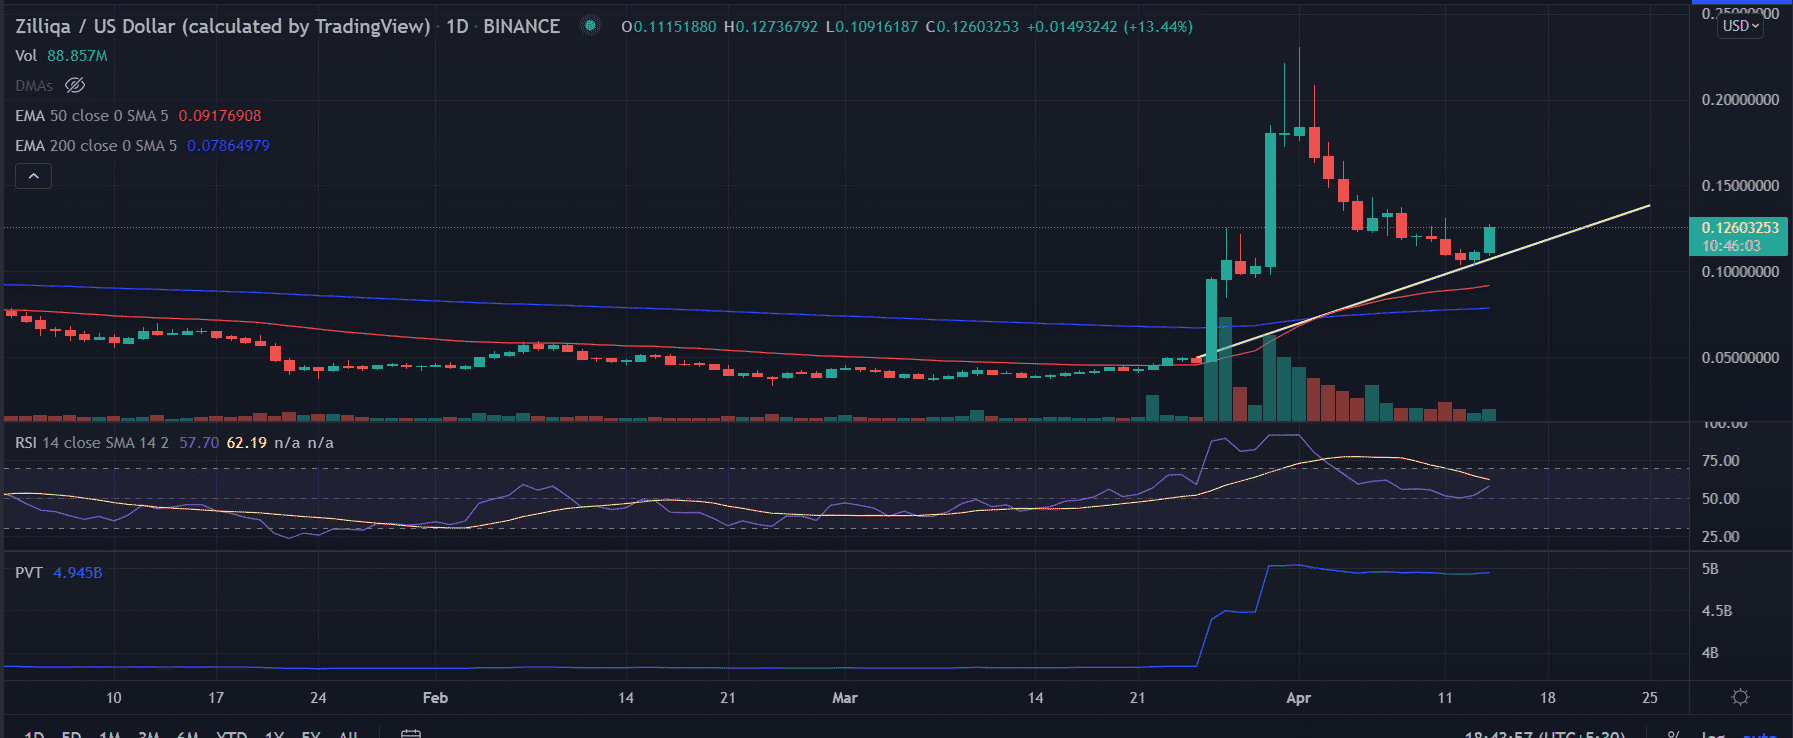
On the daily chart, the ZIL price found strong support near the $0.10 level. The price moves along the ascending trend line, which is extending from the low of $0.04 made on March 26.
The price rallied more than 400% to the all-time high of $0.23 made on April 1. Since then the price retraced nearly 56% to the swing lows of $0.10. The bullish slop line acts as a support for the bulls.
Currently, a big green candlestick indicates the strong bullish momentum that pushed the price higher. Now, a daily close above the session high would bring more gains at the highs of April 4 at $0.16.
On the flip side, a spike in sell order would invalidate the bullish outlook on the asset. Further, a break below the ascending trend line would amplify the selling toward the 50-day EMA at $0.90, followed by $0.75.
Technical indicators:
RSI: The daily relative strength index attempts to break above the average line. Currently, it reads at 55.
PVT: The price-volume trend indicates bulls are still on the front foot.
Play 10,000+ Casino Games at BC Game with Ease
- Instant Deposits And Withdrawals
- Crypto Casino And Sports Betting
- Exclusive Bonuses And Rewards


Why Trust CoinGape
CoinGape has covered the cryptocurrency industry since 2017, aiming to provide informative insights Read more…to our readers. Our journal analysts bring years of experience in market analysis and blockchain technology to ensure factual accuracy and balanced reporting. By following our Editorial Policy, our writers verify every source, fact-check each story, rely on reputable sources, and attribute quotes and media correctly. We also follow a rigorous Review Methodology when evaluating exchanges and tools. From emerging blockchain projects and coin launches to industry events and technical developments, we cover all facets of the digital asset space with unwavering commitment to timely, relevant information.

Related Articles


- Bitcoin News: Anthony Pompliano’s ProCap Buys 450 BTC, Gold Bug Peter Schiff Reacts
- Fed Rate Cuts More Likely If U.S.-Iran Conflict Extends, Arthur Hayes Predicts
- Breaking: Ethereum Treasury BitMine Adds 50,928 ETH as Tom Lee Predicts March Bottom For Crypto Prices
- Bitget Champions Women’s Role in Crypto as Part of International Women’s Day Campaign
- Breaking: Michael Saylor’s Strategy Adds 3,015 BTC as Bitcoin Holds Steady Despite U.S.-Iran War
- Pi Coin Price Prediction for March 2026 Amid Network Upgrade, KYC Boost, Rewards Distribution
- Gold Price Nears ATH; Silver Eyes $100 Breakout on Us- Iran War
- Bitcoin And XRP Price As US Kills Iran Supreme Leader- Is A Crypto Crash Ahead?
- Gold Price Prediction 2026: Analysts Expect Gold to Reach $6,300 This Year
- Circle (CRCL) Stock Price Prediction as Today is the CLARITY Act Deadline
- Analysts Predict Where XRP Price Could Close This Week – March 2026


