 Buy $GGs
MATIC’s 11% Price Surge Will Continue So Long As We Can Conquer THIS Resistance


- Matic saw a glorious 11% price surge this week as the cryptocurrency rises into the $0.02 level.
- However, the coin must conquer the resistance at $0.20 to be able to climb back to the March highs of $0.028.
MATIC surged by a total of 11% this week as the cryptocurrency rebounded from a rising trend line and climbed back above the 100-days EMA level to reach as high as $0.0216. It rolled over from this resistance and closed beneath resistance at $0.0205 (bearish .618 Fibonacci Retracement level).
MATIC has started the recovery process from when it dropped by a total of 20% in February, however, we are still not trading back at the levels just yet. Nevertheless, when MATIC breaks and closes above $0.02 we will certainly be headed back there and possibly toward the 2020 highs.
MATIC Price Analysis
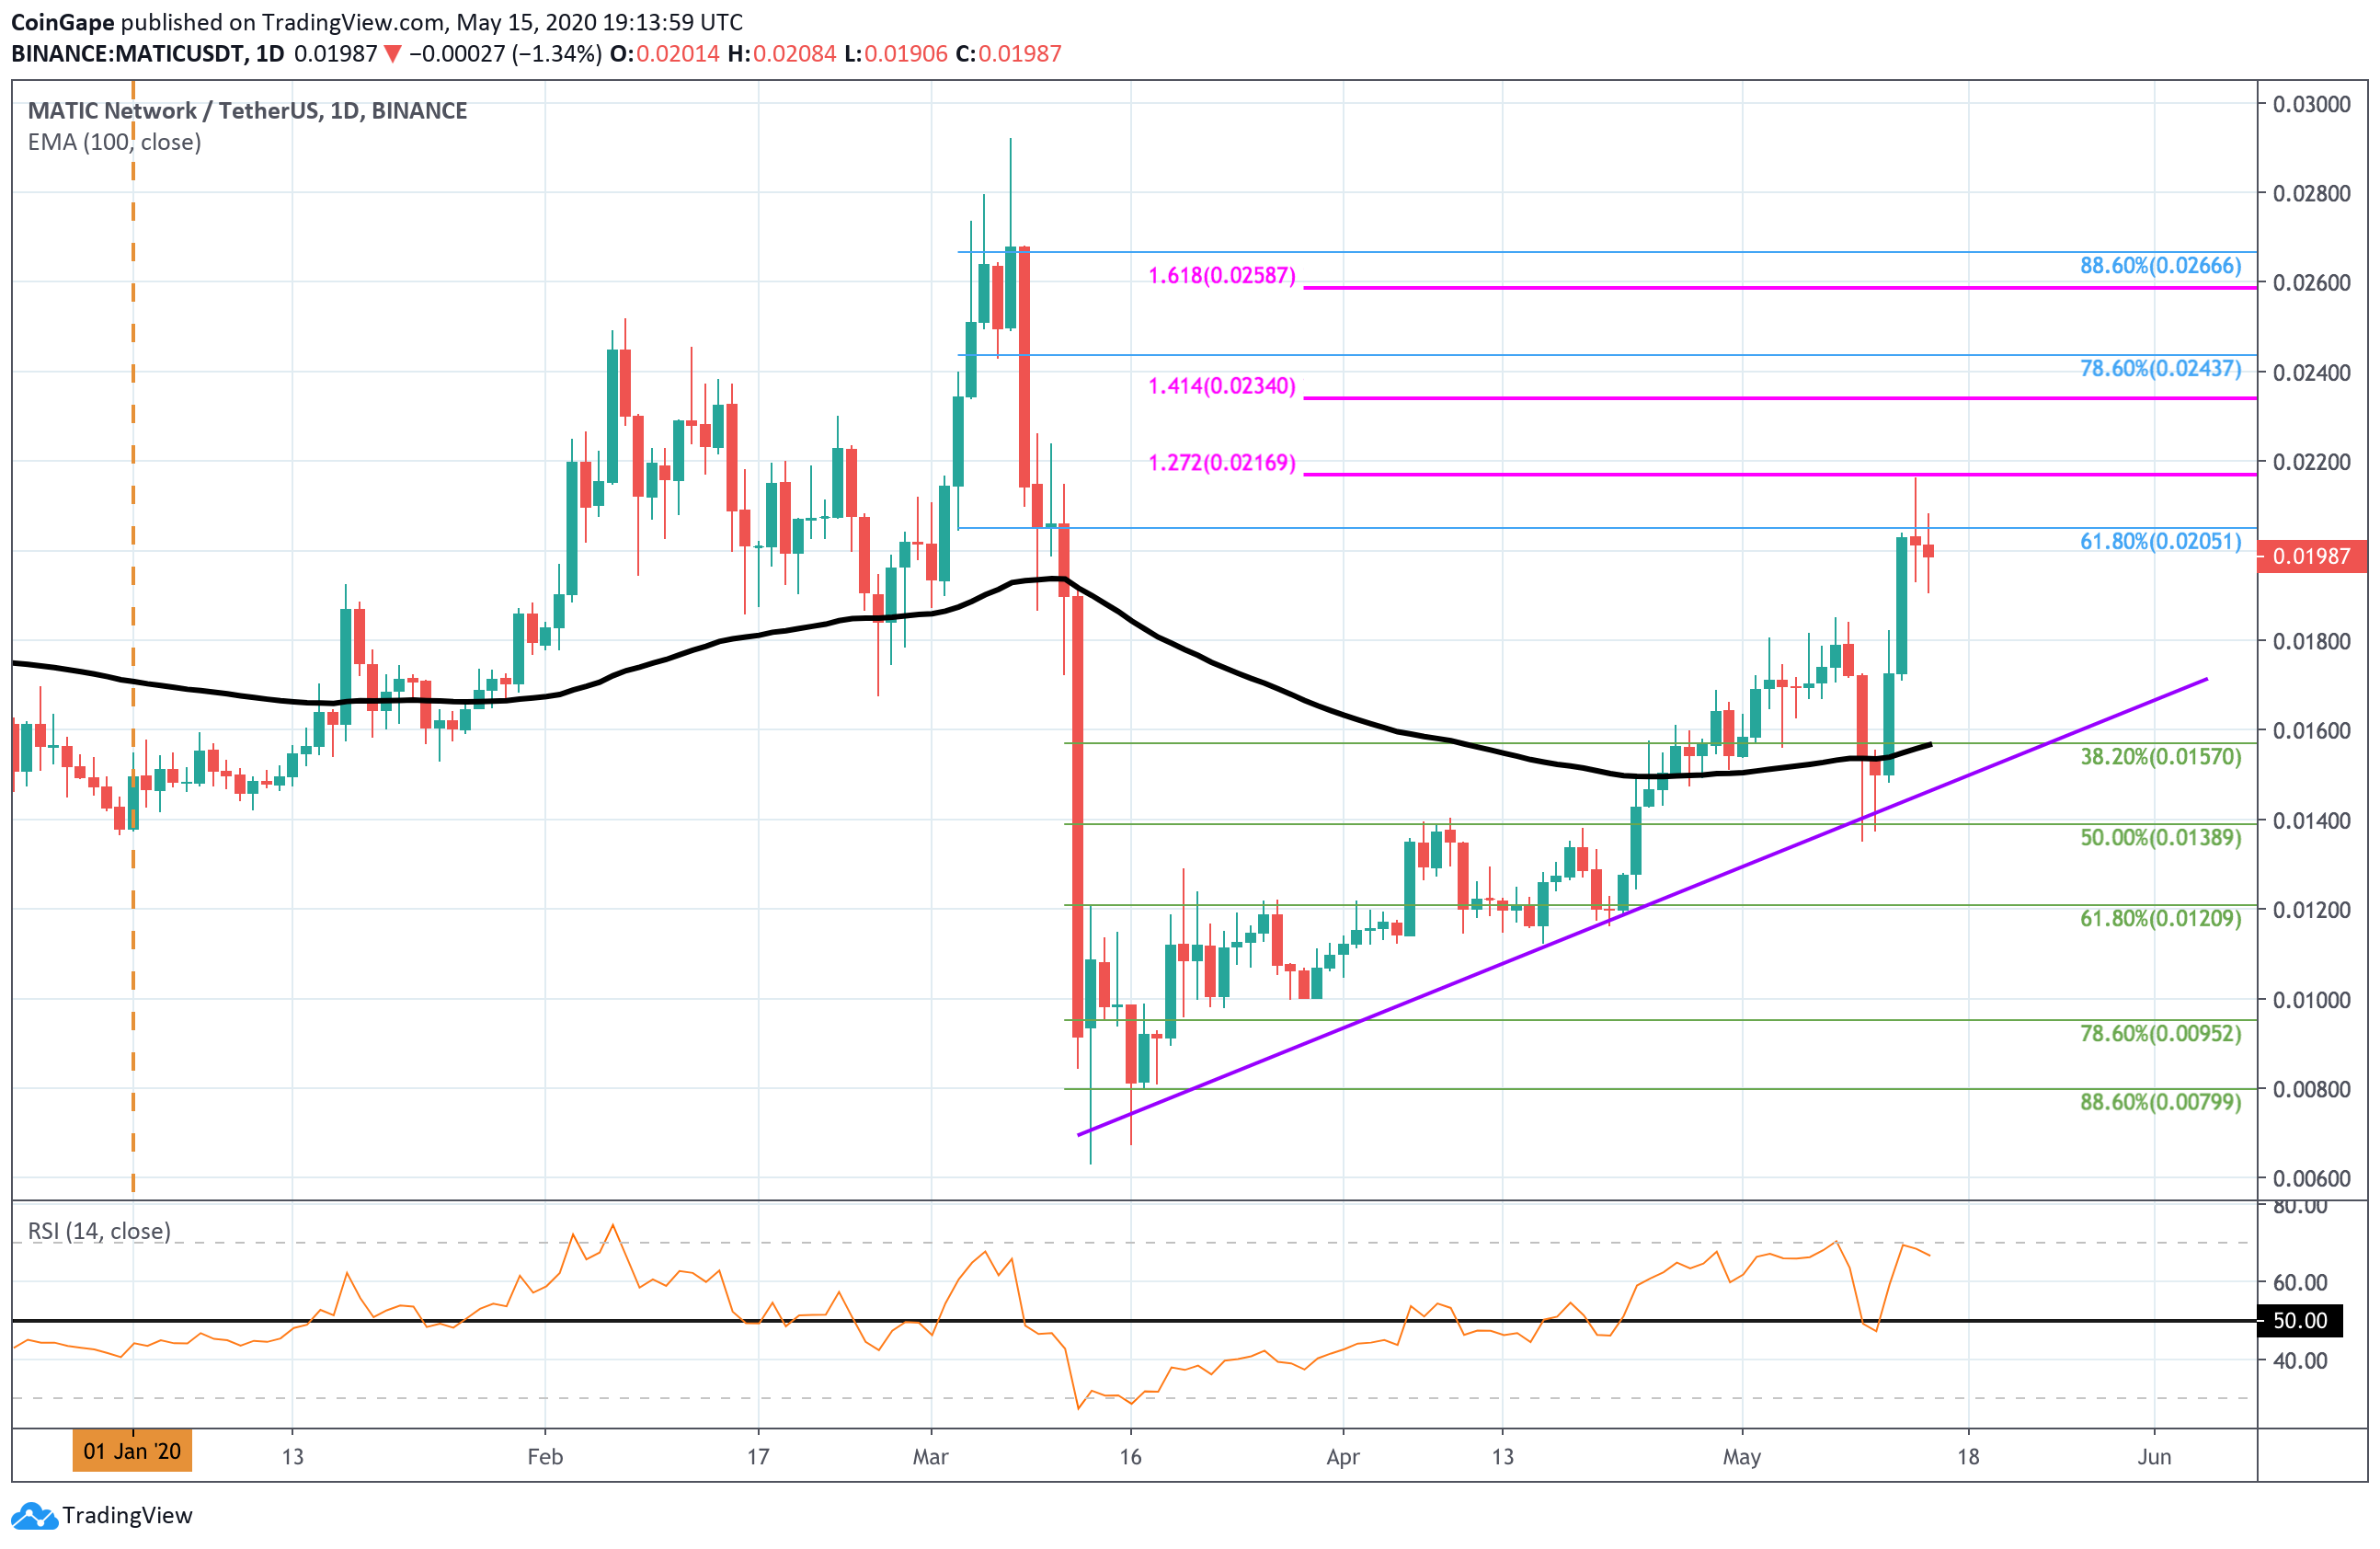
MATIC/USD – Daily CHART – SHORT TERM
-
Market Overview
Analyzing the daily chart above, we can see that MATIC dropped as low as $0.008 during the March market collapse which was caused by the Coronavirus pandemic. It quickly started to recover as it managed to break above the 100-days EMA in April at $0.015.
Over the weekend, MATIC fell from the $0.018 level and dropped back into the support at the rising trend line. This support was further bolstered by the .5 Fibonacci Retracement level at $0.0139. After rebounding, MATIC went on to break back above the 100-days EMA and surged as high as $0.0216 (1.272 Fib Extension).
Unfortunately, it dropped from this high and started to fall lower as it closed beneath the resistance at $0.20 which is provided by a bearish .618 Fibonacci Retracement level.
-
Short term prediction: BULLISH
MATIC is most certainly bullish right now and would have to drop beneath the rising trend line to be in danger of turning bearish.
If the sellers do push lower, the first level of strong support lies at $0.018. This is followed by support at $0.016 (100-days EMA & .382 Fib Retracement), the rising trend line, and $0.0138 (.5 Fib Retracement).
On the other side, once the bulls conquer the bearish .618 Fib Retracement $0.02, resistance is located at $0.0216 (1.272 Fib Extension), $0.0234 (1.414 Fib Extension), and $0.0243 (bearish .786 Fib Retracement)
- Key Levels
Support: $0.018, $0.017, $0.016, $0.0157, $0.014, $0.01389.
Resistance: $0.02, $0.0216, $0.0234, $0.0243, $0.0258.
Play 10,000+ Casino Games at BC Game with Ease
- Instant Deposits And Withdrawals
- Crypto Casino And Sports Betting
- Exclusive Bonuses And Rewards


Why Trust CoinGape
CoinGape has covered the cryptocurrency industry since 2017, aiming to provide informative insights Read more… to our readers. Our journal analysts bring years of experience in market analysis and blockchain technology to ensure factual accuracy and balanced reporting. By following our Editorial Policy, our writers verify every source, fact-check each story, rely on reputable sources, and attribute quotes and media correctly. We also follow a rigorous Review Methodology when evaluating exchanges and tools. From emerging blockchain projects and coin launches to industry events and technical developments, we cover all facets of the digital asset space with unwavering commitment to timely, relevant information.

Delivered every day.
- Insights that move markets
- 100,000 active subscribers
Related Articles


- Crypto Market Bill Hits New Deadlock as Banks Reject White House Deal
- Why Experts Are Warning Bitcoin Rally Could Be A “Dead Cat Bounce”
- BTC and Gold Price Bounce as Trump Admin Brokers US-Venezuela 1000 Kg Gold Deal
- SEC Advances Major Crypto Securities Plan to White House for Approval
- Peter Brandt Flips Bullish, Predicts Bitcoin Rally As Price Holds Above $70k
- Pi Network Price As BTC Rallies Above $74K: Can PI Coin Extend Gains to $0.30?
- XRP Price As Bitcoin Reclaims $74K- Is $5 Next?
- Dogecoin Price Outlook as BTC Recovers Above $73,000
- XRP Price Prediction as Iran-U.S. Peace Talks Trigger a Crypto Rally
- COIN Stock Analysis as Bitcoin Retests $72k Ahead of February NFP Data
- Robinhood Stock Price Prediction As Cathie Wood Buys $12M Dip in Bold ARK Move


