Polkadot(DOT) Price Establishing a key Weekly Range, Will DOT Price Swing High Past ATH?


DOT price is important weekly close coming up that will determine the momentum of the prevailing bullish trend. Price action is to close in resemblance to a bullish hammer which will indicate strong momentum to the upside.
- Price Action Equilibrium Bull Break
- Weekly S/R Established and respected
- Strong Bullish Volatility Expansion
DOT Price Analysis: Weekly Chart
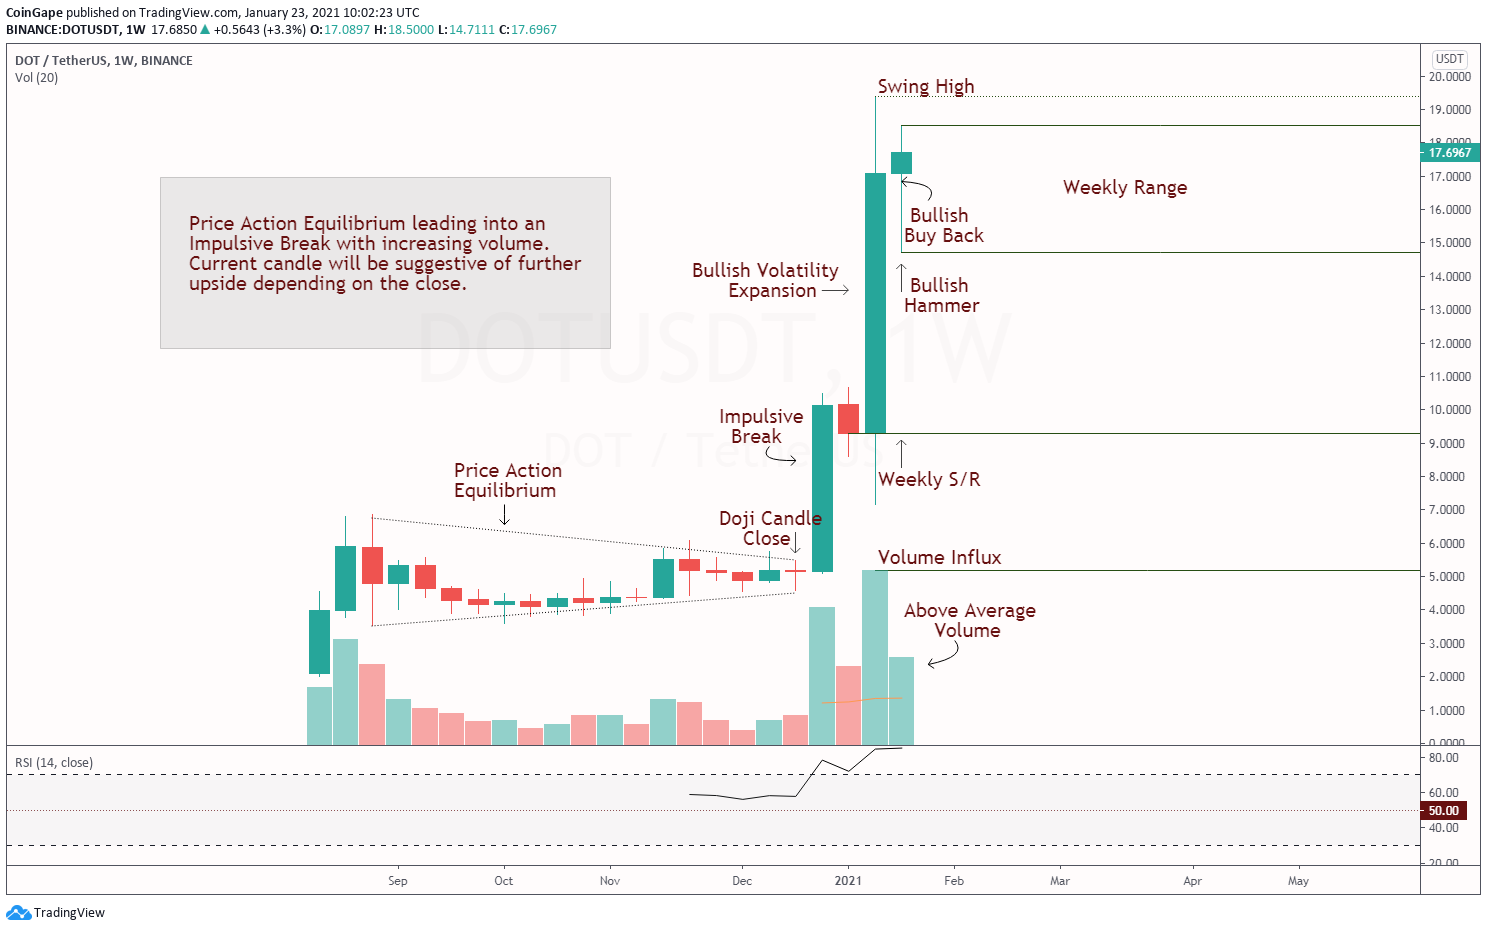
Observing the chart we can see price action forming equilibrium where supply and demand balances before an impulsive break. Evidently being the case this break was a bullish one that followed suite after a Doji Candle Close. The expansion was backed with increasing volume as reflected in the volume profile; this indicated a true break in nature. Follow through was evident that led to an initial bullish volatility expansion.
A Weekly S/R was established successfully as price action held a base for two consecutive candle closes, this base associated around the $9.50 region.
Holding this level was crucial for a bullish bias as volume indicated strength with follow-though being imminent, again evidently being the case. The providential fact that this level got respected was a tail sign of further upside.
A strong bullish volatility expansion followed suit as price action continued to rise with increasing volume. DOT price managed to put in a swing high at $19.40, marking the all-time high and the current objective for a continuation. A well-established weekly range has now come to fruition, with a weekly close in the coming days, will determine the likely-hood of taking out swing high. As of current there has been a strong buy back in price action resembling a bullish hammer. How this next weekly candle closes will determine the momentum of the prevailing bullish weekly volatility expansion.
Hope this article helps when making discretionary decisions.

Why Trust CoinGape
CoinGape has covered the cryptocurrency industry since 2017, aiming to provide informative insights Read more… to our readers. Our journal analysts bring years of experience in market analysis and blockchain technology to ensure factual accuracy and balanced reporting. By following our Editorial Policy, our writers verify every source, fact-check each story, rely on reputable sources, and attribute quotes and media correctly. We also follow a rigorous Review Methodology when evaluating exchanges and tools. From emerging blockchain projects and coin launches to industry events and technical developments, we cover all facets of the digital asset space with unwavering commitment to timely, relevant information.

Delivered every day.
- Insights that move markets
- 100,000 active subscribers