 Buy $GGs
Polkadot Price Analysis: DOT is drawing closer to a 31% upswing, eying $50


- Polkadot is trading at the apex of a symmetrical triangle pattern ahead of the anticipated liftoff to 50.
- The resistance at $40 remains the biggest hindrance to the bullish outlook.
Polkadot is among the few cryptoassets set to begin the week in the green. Bitcoin surprised many by making a real break above $60,000 over the weekend. DOT is most likely following in its footsteps to achieve another record high.
Meanwhile, DOT is trading at the apex of a symmetrical triangle. This pattern highlights a period of consolidation in addition to a potential breakout or breakdown.
The symmetrical triangle is formed by two trendlines whereby one connects a series of higher lows and a series of higher lows. A breakout will occur as soon as the price slices through the upper trendline. The move to the north is usually drastic and confirmed by a sudden increase in trading volume. Triangle breakouts have exact targets measure from the pattern’s highest to lowest points.
Polkadot is very close to breaking above the upper trendline, where it will launch 31% higher to a new all-time high. The anticipated upswing will be reinforced if the MACD sustains the cross above the signal line. Moreover, the indicator should stay within the positive region to secure the bullish impulse.
DOT/USD 4-hour chart
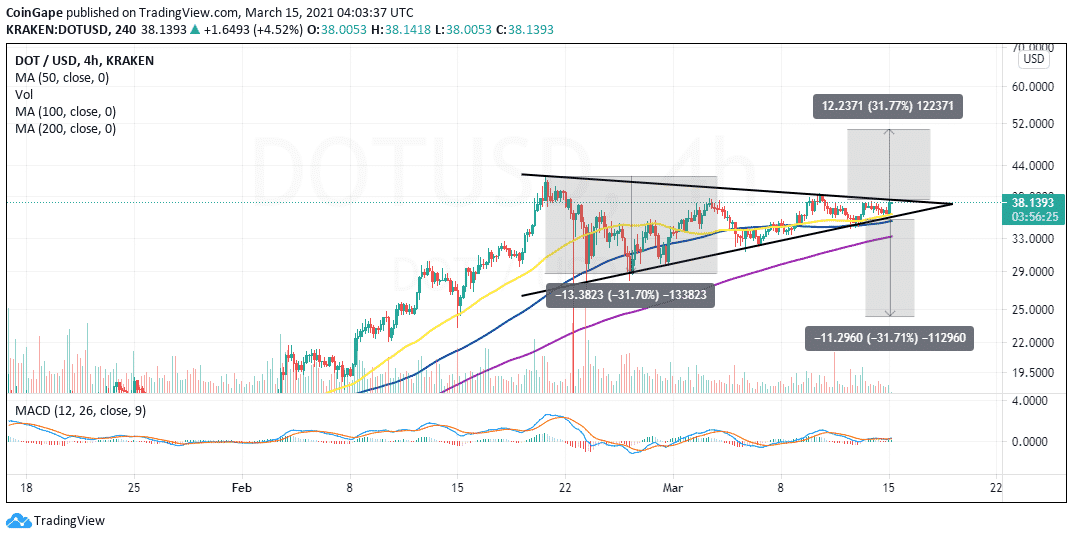
Note that the bullish outlook will fail to hold if Polkadot upside is continually limited under the upper trendline, and by association, the seller congestion at $40. On the downside, the 50 Simple Moving Average is in line to offer support. Massive losses eyeing levels under $25 will come into the picture in the symmetrical triangle breakdown.
Play 10,000+ Casino Games at BC Game with Ease
- Instant Deposits And Withdrawals
- Crypto Casino And Sports Betting
- Exclusive Bonuses And Rewards


Why Trust CoinGape
CoinGape has covered the cryptocurrency industry since 2017, aiming to provide informative insights Read more… to our readers. Our journal analysts bring years of experience in market analysis and blockchain technology to ensure factual accuracy and balanced reporting. By following our Editorial Policy, our writers verify every source, fact-check each story, rely on reputable sources, and attribute quotes and media correctly. We also follow a rigorous Review Methodology when evaluating exchanges and tools. From emerging blockchain projects and coin launches to industry events and technical developments, we cover all facets of the digital asset space with unwavering commitment to timely, relevant information.

Delivered every day.
- Insights that move markets
- 100,000 active subscribers
Related Articles


- Bitcoin Faces $1.8B in Panic Selling as U.S.-Iran Airstrikes Escalate; Will BTC Crash Below $60k?
- Gold ETF vs Tokenized Gold: Who Could Outperform in 2026?
- Crypto Weekly Wrap: Jane Street Targeted After Terra Suit, Vitalik’s ETH Selloffs, Regulatory Progress Feb 23-27
- Meme Coin Market Dead? Top 5 Reasons Dogecoin, Shiba Inu, and Pepe Are Crashing
- Crypto Market Crashes as U.S.-Iran Tensions Escalate With Airstrikes
- Top Analyst Predicts Pi Network Price Bottom, Flags Key Catalysts
- Will Ethereum Price Hold $1,900 Level After Five Weeks of $563M ETF Selling?
- Top 2 Price Predictions Ethereum and Solana Ahead of March 1 Clarity Act Stablecoin Deadline
- Pi Network Price Prediction Ahead of Protocol Upgrades Deadline on March 1
- XRP Price Outlook As Jane Street Lawsuit Sparks Shift in Morning Sell-Off Trend
- Dogecoin, Cardano, and Chainlink Price Prediction As Crypto Market Rebounds


