 Buy $GGs
Polkadot Price Forecast: DOT recovery becomes an uphill battle while overhead pressure mounts


- Polkadot hits a snag under $35, abandoning the upswing to highs past $40.
- DOT seeks support at the 50 SMA on the 4-hour chart while trying to avert declines under $30.
Polkadot had staged an impressive recovery on Monday, extending the bullish leg from the recently formed support at $27. The token hit highs above $30 and pushed for gains beyond $35. However, bulls lost steam within a whisker of a confluence resistance created by the 100 Simple Moving Average (SMA) and the 200 SMA on the 4-hour chart.
The mission to achieve a new record high beyond $40 seems to be a pipedream at the time of writing due to increased resistance beneath the confluence level. DOT seeks higher support at the 50 Simple Moving Average (SMA). If this immediate anchor fails to hold, we can expect DOT to tumble further and perhaps retest $30.
The Moving Average Convergence Divergence (MACD) indicator had flipped massively bullish from last week. However, the indicator’s upward momentum has dramatically reduced. At the time of writing, the MACD line prints a horizontal trend, implying that the slightest resistance path is sideways.
DOT/USD 4-hour chart
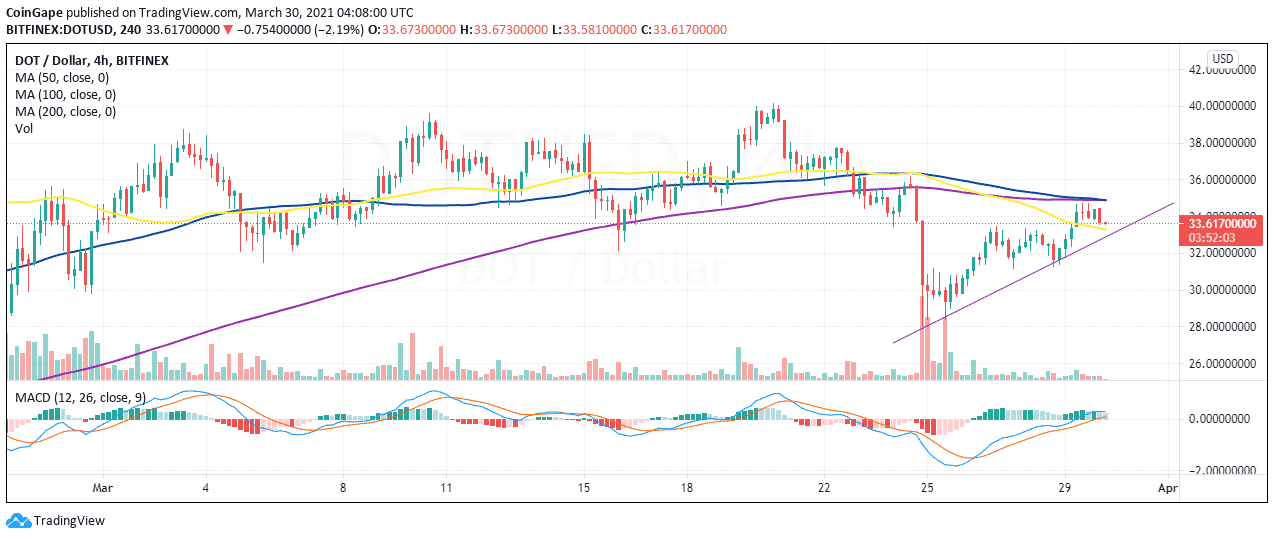
On the other hand, traders should be on the lookout for the MACD’s return into the positive region. Besides, if the MACD line (blue) crosses under the signal line, massive sell orders are likely triggered. Another dip below $30 may not stop at $27 but could extend the bearish leg beneath $20.
On the upside, holding the support at the 50 SMA on the 4-hour chart will ensure market stability. Bulls will then have the time to focus on rebuilding the uptrend toward $40. Another bullish signal would be settling above the confluence resistance at $35.
Polkadot intraday levels
Spot rate: $33.6
Trend: Bearish
Volatility: Low
Support: 50 SMA on the 4-hour chart, $30 and $27
Resistance: $35 and $40
Play 10,000+ Casino Games at BC Game with Ease
- Instant Deposits And Withdrawals
- Crypto Casino And Sports Betting
- Exclusive Bonuses And Rewards


Why Trust CoinGape
CoinGape has covered the cryptocurrency industry since 2017, aiming to provide informative insights Read more… to our readers. Our journal analysts bring years of experience in market analysis and blockchain technology to ensure factual accuracy and balanced reporting. By following our Editorial Policy, our writers verify every source, fact-check each story, rely on reputable sources, and attribute quotes and media correctly. We also follow a rigorous Review Methodology when evaluating exchanges and tools. From emerging blockchain projects and coin launches to industry events and technical developments, we cover all facets of the digital asset space with unwavering commitment to timely, relevant information.

Delivered every day.
- Insights that move markets
- 100,000 active subscribers
Related Articles


- CLARITY Act: Stablecoin Yield Debate Heats Up, but March 1 Deadline Not ‘Do or Die’
- Best Institutional Custody Solutions for Tokenized Assets in 2026
- Minnesota Considers Ban on Bitcoin and Crypto ATMs as Scam Reports Rise
- Breaking: Morgan Stanley Applies For Crypto-Focused National Trust Bank With OCC
- Ripple Could Gain Access to U.S. Banking System as OCC Expands Trust Bank Services
- Top Analyst Predicts Pi Network Price Bottom, Flags Key Catalysts
- Will Ethereum Price Hold $1,900 Level After Five Weeks of $563M ETF Selling?
- Top 2 Price Predictions Ethereum and Solana Ahead of March 1 Clarity Act Stablecoin Deadline
- Pi Network Price Prediction Ahead of Protocol Upgrades Deadline on March 1
- XRP Price Outlook As Jane Street Lawsuit Sparks Shift in Morning Sell-Off Trend
- Dogecoin, Cardano, and Chainlink Price Prediction As Crypto Market Rebounds


