 Buy $GGs
MATIC Price Analysis: Weekly and 4 Hr Chart Analyses Reveals Buy Signal for Polygon


Polygon recently set a new record for highest bounty paid in DeFi. The team at Polygon paid a two million US dollar worth of bounty to Gerhard Wagner, a white hat hacker who discovered a crucial vulnerability that had put around 850 million US dollars’ worth of capital at risk.
So what type of vulnerability could this be? Well, it’s a double-spend bug, a type of bug that could have tuned catastrophic for the Polygon ecosystem.
Bullish/Bearish Scenario
- The bear-trap candlestick formation on the weekly time frame, alongside the buildup of bullish divergence on the 4HR time frame, shows that the bulls are back in control.
- A breakdown of the 1.152 support implies a bearish takeover.
Important Weekly Polygon (MATIC) Announcements
- Immunefi, a bug bounty, and security platform acknowledged that the bounty is the highest that has been paid in decentralized finance [DeFi].
- Another exciting announcement in the Polygon ecosystem is the PECO-Polygon Ecosystem Index, which makes it possible for participants to bet on the performance of Polygon [MATIC] projects. The PECO Index is a single token that captures the best native projects on @xPolygon.
Without any further delay, Let’s analyze the MATICUSDT price chart.
Polygon (MATIC) Price Analysis: MATICUSDT Weekly Chart
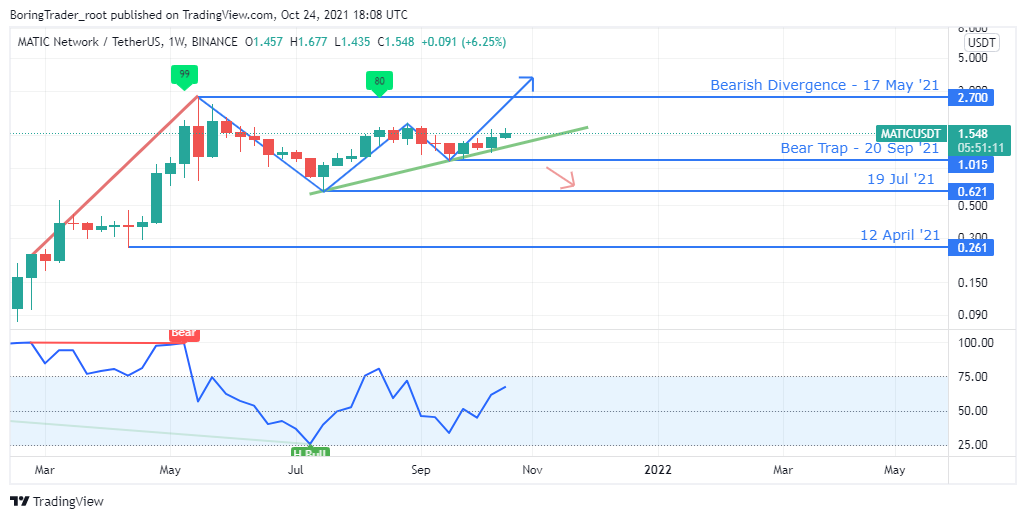
Following the path of most top altcoins in the cryptocurrency market, the MATICUSDT triggers a bear-trap candlestick formation while trading within a rising and expanding wedge.
Although the crypto pair still trades below its all-time high, higher RSI readings above level-25 tell us that we are still in an uptrend and we may soon see a surge in demand for the MATIC token.
Polygon (MATIC) Price Analysis: MATICUSDT Daily Chart
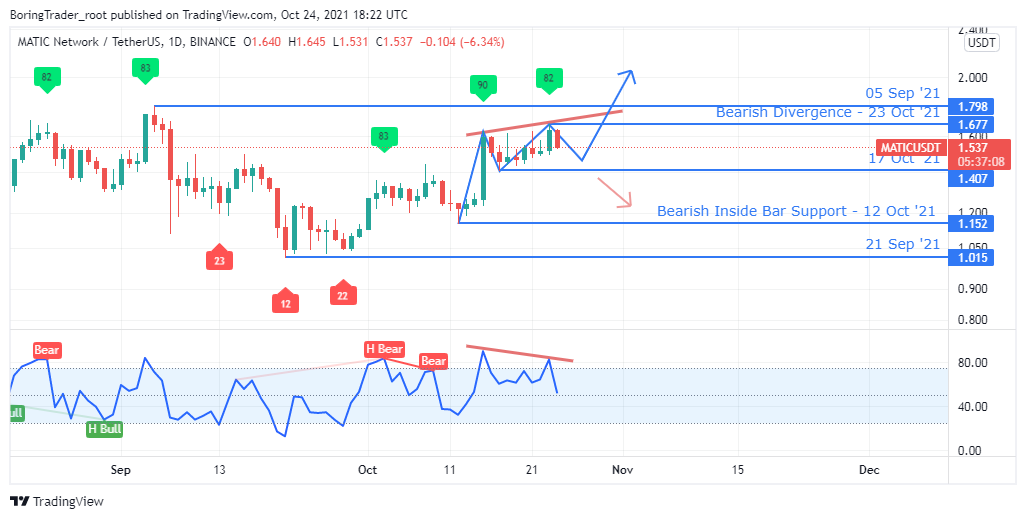
A recent regular bearish divergence on the daily chart above shows that we may soon see a slowing and possible correction of current gains.
Failure of RSI values to breach below level-25 would suggest a continuation of the current uptrend.
Polygon (MATIC) Price Analysis: MATICUSDT 4 Hr Chart
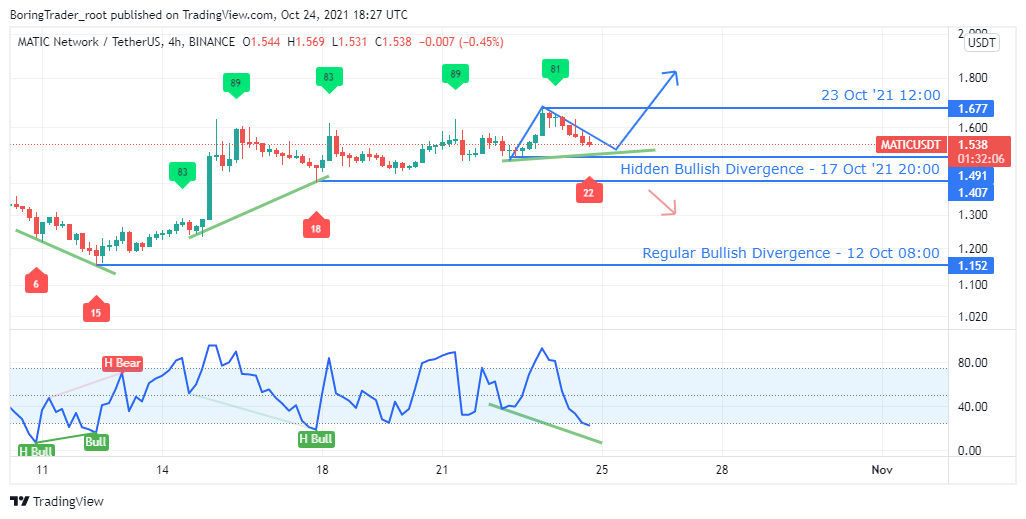
As the RSI prints higher values above level-25 on the daily time frame, the 4HR time frame confirms entry into the uptrend with an exit of the oversold area [level-25] with the recent entry of oversold at press time.
Regular and hidden bullish divergence setups are instrumental for the previous trend reversal and current trend continuation we see on the above intraday chart.
An impending hidden bullish divergence at press time may be sufficient for the bulls to find a price floor above the 1.491 support and restore the MATIC price into new highs.
Play 10,000+ Casino Games at BC Game with Ease
- Instant Deposits And Withdrawals
- Crypto Casino And Sports Betting
- Exclusive Bonuses And Rewards


Why Trust CoinGape
CoinGape has covered the cryptocurrency industry since 2017, aiming to provide informative insights Read more… to our readers. Our journal analysts bring years of experience in market analysis and blockchain technology to ensure factual accuracy and balanced reporting. By following our Editorial Policy, our writers verify every source, fact-check each story, rely on reputable sources, and attribute quotes and media correctly. We also follow a rigorous Review Methodology when evaluating exchanges and tools. From emerging blockchain projects and coin launches to industry events and technical developments, we cover all facets of the digital asset space with unwavering commitment to timely, relevant information.

Delivered every day.
- Insights that move markets
- 100,000 active subscribers
Related Articles


- US-Iran War: Reports Confirm Bombings In UAE, Bahrain and Kuwait As Crypto Market Makes Recovery
- XRP Price Dips on US-Iran Conflict, But Capitulation Signals March Rebound
- Crypto Market at Risk as U.S.–Iran War Threatens Inflation With Oil Price Surge
- Polymarket U.S.–Iran Strike Bets Fuel Insider Trading Speculation as Crypto Traders Net $1.2M
- Cardano’s DeFi TVL Climbs as USDCx Stablecoin Launches on Network
- Top Analyst Predicts Pi Network Price Bottom, Flags Key Catalysts
- Will Ethereum Price Hold $1,900 Level After Five Weeks of $563M ETF Selling?
- Top 2 Price Predictions Ethereum and Solana Ahead of March 1 Clarity Act Stablecoin Deadline
- Pi Network Price Prediction Ahead of Protocol Upgrades Deadline on March 1
- XRP Price Outlook As Jane Street Lawsuit Sparks Shift in Morning Sell-Off Trend
- Dogecoin, Cardano, and Chainlink Price Prediction As Crypto Market Rebounds


