Price Analysis: Fantom And BitTorrent Post New Gains, Technicals Suggests Otherwise


Fantom has been on a roll lately, with consistent gains across its charts since December 20. Over the past week, FTM alone had posted 54.2% gains. BitTorrent, however, displayed restricted price action in the past couple of weeks; overnight, the coin gained 4.7%.
BTT broke its consolidation, although it cannot be ascertained if BTT will continue to move at this pace over the upcoming price action.
BitTorrent attempted to break over its overhead price resistance, but it couldn’t trade above the same price ceiling. Crucial price levels have been discussed below for both coins.
FTM/USD Four Hour Chart
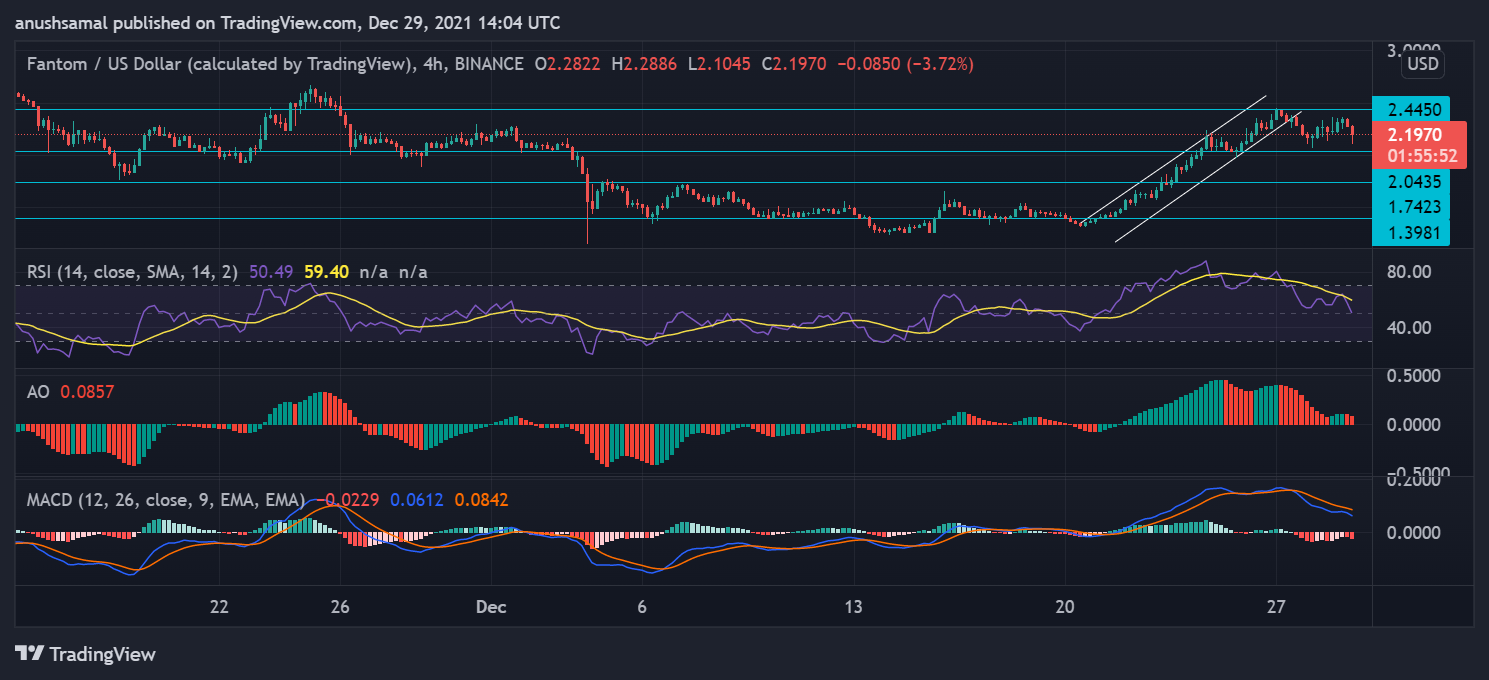
Over the last 24 hours, FTM rose by 3.3%, but traders might just be cashing out their recent gains. Fantom was priced at $2.19, and its immediate price resistance stood at $2.44. Technicals for the coin painted a mixed trading signal at the time of writing.
If buyers resurfaced, the coin could attempt to trade above the $2.44 mark, but if sellers dominate the market, FTM could fall to the $2.04 level. Additional support lines rested at $1.74 and 1.39.
The Relative Strength Index had noted a considerable downtick as the indicator stood slightly above the half-line, indicating that buyers were declining in strength although RSI remained slightly bullish.
Awesome Oscillator, too, displayed slight bearish sentiments in the market; however, AO could witness an upturn if buyers remained in the market for the upcoming trading sessions.
MACD displayed red histograms after undergoing a bearish crossover; indicators mainly flashed signs of an upcoming price reversal.
BTT/USD Four Hour Chart
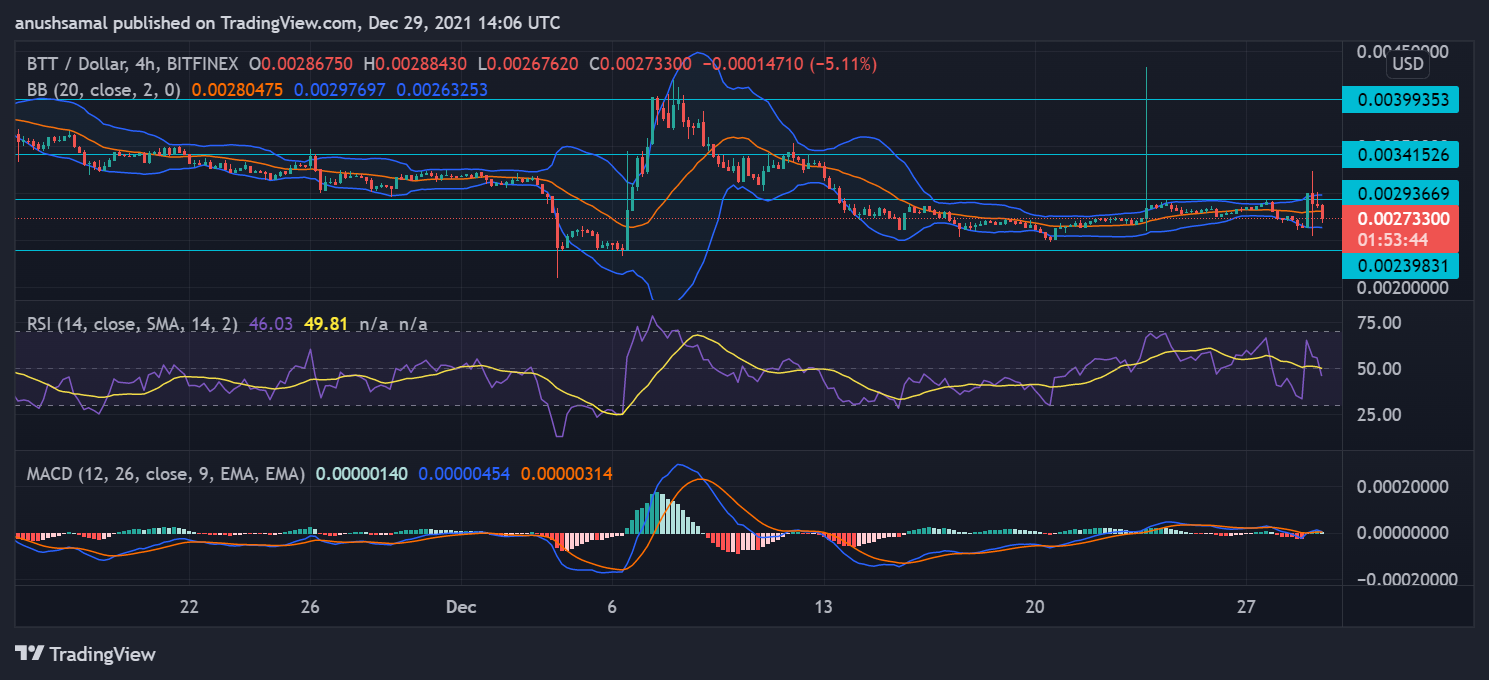
BitTorrent was changing hands at $0.0027, and the coin noted an appreciation of 4.7% in the past day. The trading range for the coin stood between $0.0029 and $0.0023, respectively. The altcoin had experienced sideways trading for a considerable time before breaking out on the upside.
Despite BTT breaking over the $0.0029 resistance mark, the coin could not hold onto the move and dipped below that making $0.0029 a robust price ceiling for the coin.
The Relative Strength Index was bearish as the indicator fell below the half-line, which signified an increase of sellers in the market.
MACD flashed red histograms right after it encountered a bearish crossover. Regarding price volatility, BTT could experience some price fluctuations as Bollinger Bands opened up at the time of writing.

Why Trust CoinGape
CoinGape has covered the cryptocurrency industry since 2017, aiming to provide informative insights Read more… to our readers. Our journal analysts bring years of experience in market analysis and blockchain technology to ensure factual accuracy and balanced reporting. By following our Editorial Policy, our writers verify every source, fact-check each story, rely on reputable sources, and attribute quotes and media correctly. We also follow a rigorous Review Methodology when evaluating exchanges and tools. From emerging blockchain projects and coin launches to industry events and technical developments, we cover all facets of the digital asset space with unwavering commitment to timely, relevant information.

Delivered every day.
- Insights that move markets
- 100,000 active subscribers


