SUSHI Price Analysis: SUSHIUSD Accumulation Phase Leading to a Strong Price Action Parabolic Curve


- Evident Accumulation Phase
- Daily S/R Flip Continuation
- Bullish Order Block Support
- RSI Bullish Control Zone
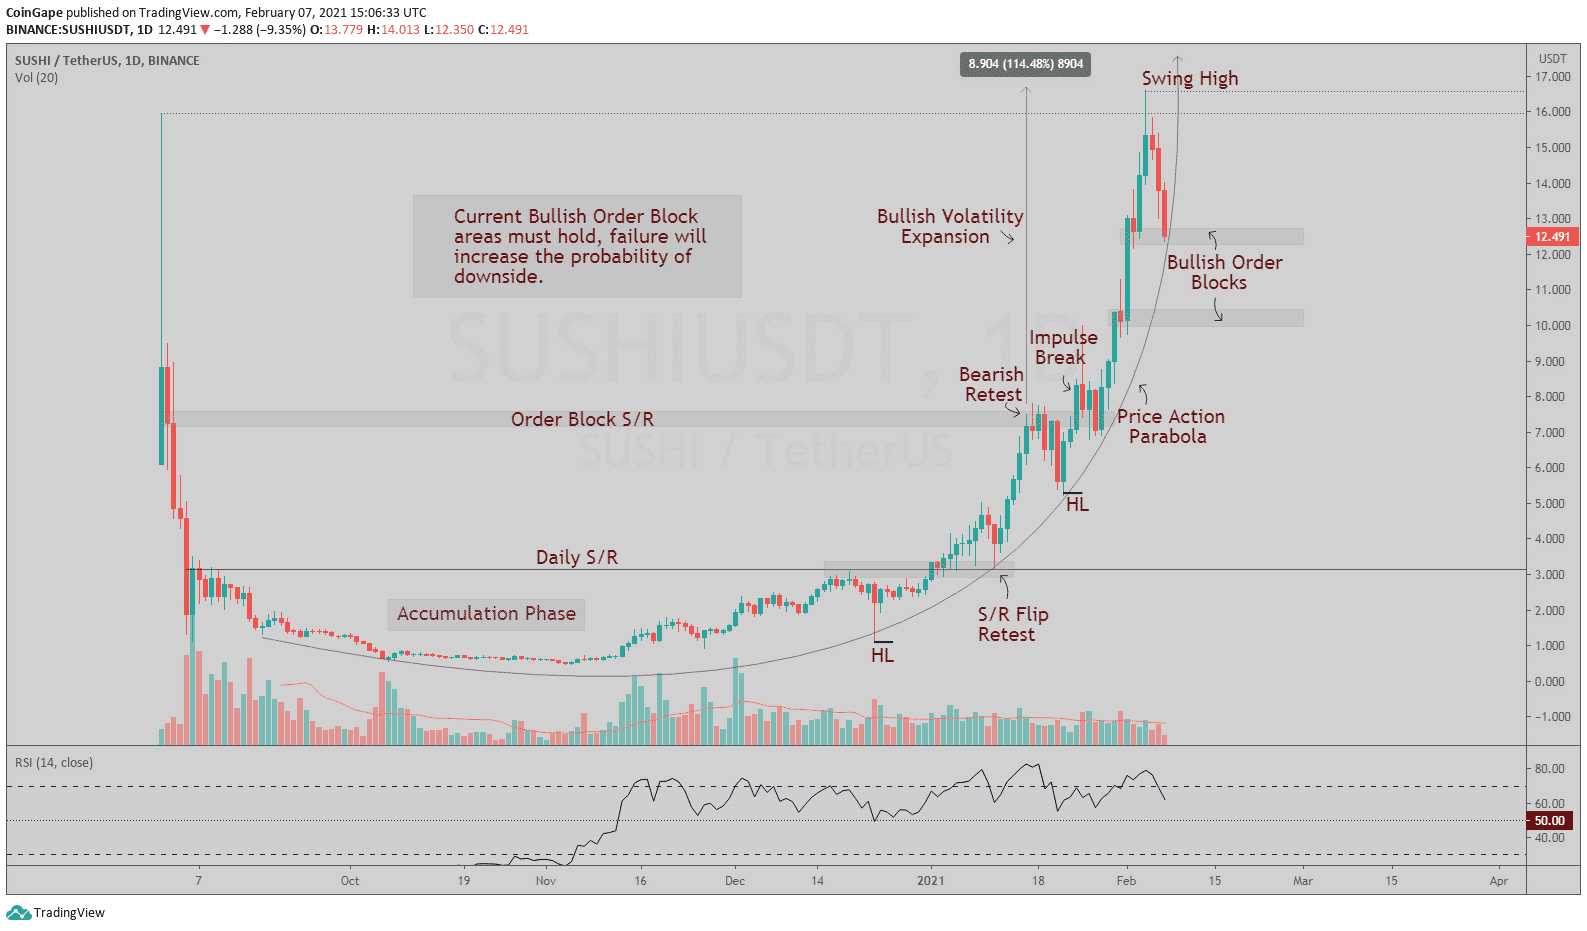
SUSHIUSDT’s current Market Structure is deemed extremely Bullish with consecutive Higher Highs and Higher Lows. Trading in a parabolic fashion, the current Swing High has become a key objective for a trend continuation. The current Price Action is trading at a true trade location where a volatile move will be imminent.
SUSHIUSDT Daily Price Action Chart
Observing the chart above, we can see Price Action in a clear Accumulation Phase that initially led to the strong Bullish Volatility Expansion. This period lasted for a total of 129 Days before a confirmed S/R Flip Retest. Being a clear and strong retest of the technical level, it led to an immediate continuation into the Order Block S/R.
The Preliminary test of the Order Block resulted into a Bearish Retest, Price Action had a slight deviation before an impulse back up, this confirmed a technical Higher Low. Upon confirmation, a local Apex was morphed causing an impulse in Price Action that led to a break of the Oder Block S/R Resistance.
The flipping of the staunched resistance was a pivotal point; Volume evidently increased causing a further Bullish Expansion. At the time, the Parabola was in full effect as Price Action impulsed into a strong expansion before confirming Price Discovery. The Wick of the Swing High is the current All-Time Highs, breaching the level will greatly increase the probability of a continuation. Failure to hold the current Bullish Order Block will prominently increase the probability of a correction.
SUSHIUSDT Daily RSI
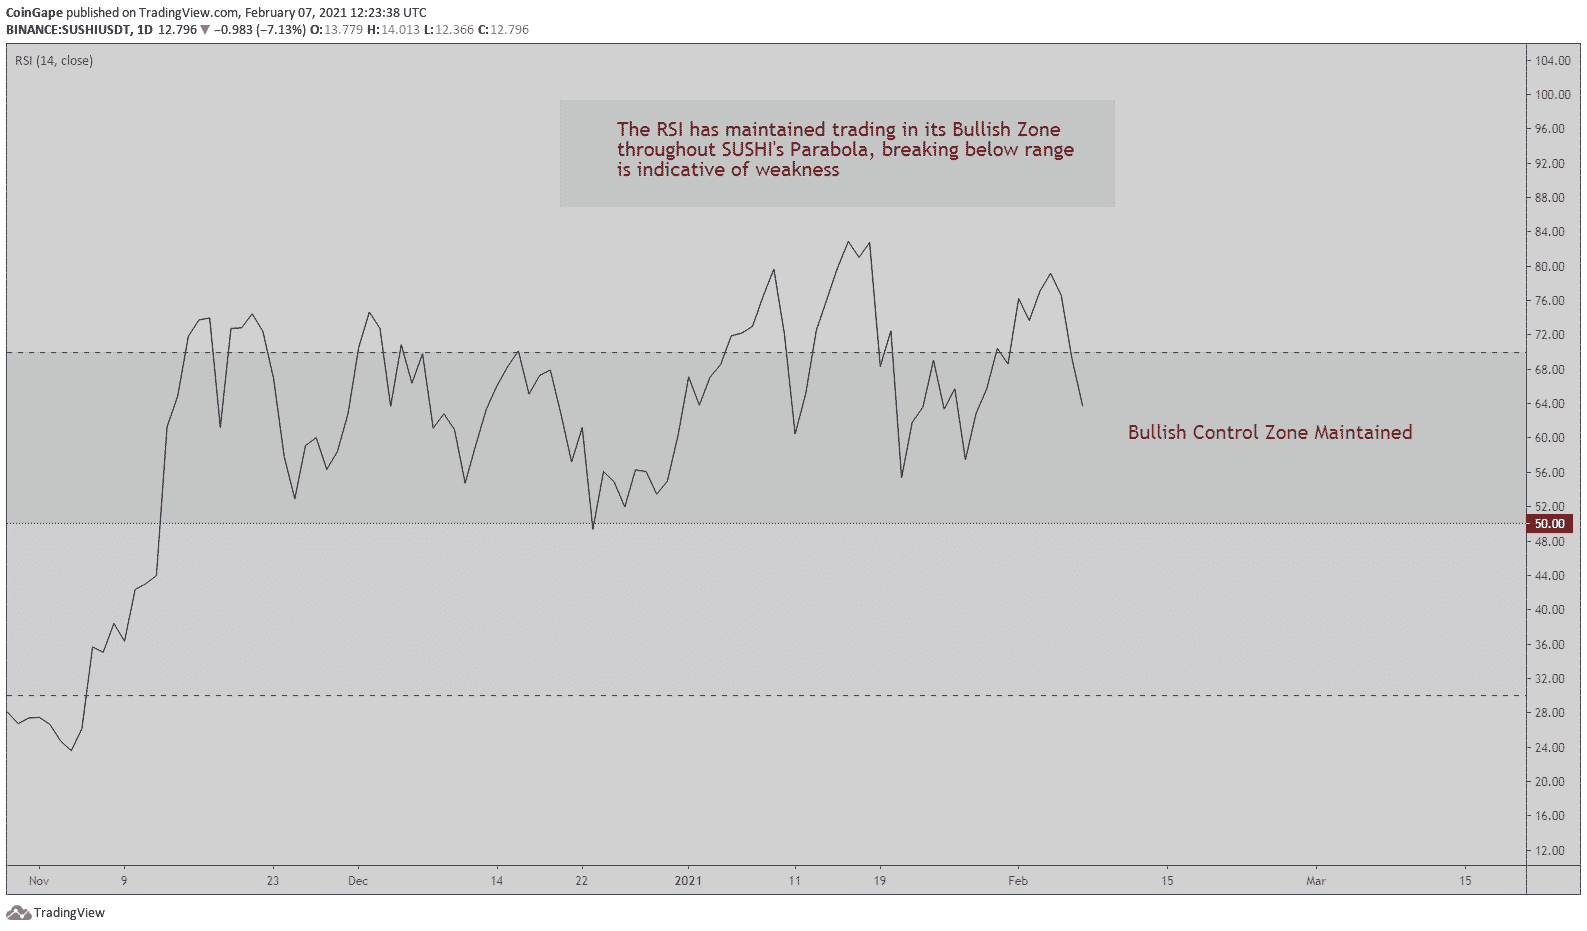
Discerning the present RSI, there is a clear correlation in respect to the strength of Price Action as the Bullish Control Zone has been maintained. Holding these regions are critical to maintain a Bullish Directional Bias, penetrating the Range-Mid will show immediate weakness. The Bearish Control Zone will indicate a potential correction in Price Action after such a strong rise.
To conclude, SUSHIUSDT remains bullish until a clear break of the Price Action Parabola comes to fruition. As of current, the Bullish Order Block S/R being tested must hold, failure will increase the probability of a short term correction. The RSI is a key indicator in this trend as the Bullish Control Zone has been maintained, deviating from this region will be indicative of weakness.
Hope this article helps in making discretionary trading decisions.

Why Trust CoinGape
CoinGape has covered the cryptocurrency industry since 2017, aiming to provide informative insights Read more… to our readers. Our journal analysts bring years of experience in market analysis and blockchain technology to ensure factual accuracy and balanced reporting. By following our Editorial Policy, our writers verify every source, fact-check each story, rely on reputable sources, and attribute quotes and media correctly. We also follow a rigorous Review Methodology when evaluating exchanges and tools. From emerging blockchain projects and coin launches to industry events and technical developments, we cover all facets of the digital asset space with unwavering commitment to timely, relevant information.

Delivered every day.
- Insights that move markets
- 100,000 active subscribers
Related Articles


- XRP News: French Banking Giant Taps XRPL for Euro Stablecoin With Ripple Support
- Kalshi Better at Predicting FOMC Rate Decisions, US CPI Than Fed Funds Futures: FED Research
- Congress to Revisit Crypto Market Structure Bill in Key Meeting Tomorrow
- Trump’s World Liberty Financial Partners With Securitize in Tokenization of Real Estate
- Coinbase Adds XRP, ADA, LTC, DOGE as Collateral for Crypto-Backed Loans
- Ripple Prediction: Will Arizona XRP Reserve Boost Price?
- Dogecoin Price Eyes Recovery Above $0.15 as Coinbase Expands Crypto-Backed Loans
- BMNR Stock Outlook: BitMine Price Eyes Rebound Amid ARK Invest, BlackRock, Morgan Stanley Buying
- Why Shiba Inu Price Is Not Rising?
- How XRP Price Will React as Franklin Templeton’s XRPZ ETF Gains Momentum
- Will Sui Price Rally Ahead of Grayscale’s $GSUI ETF Launch Tomorrow?


