 Buy $GGs
Tezos, Decentraland and Vechain Price Analysis: DeFi Coins Up More Than 6%


Tezos was on downfall over the past few days shortly after it rallied on December 6. However, at press time, it was trading for $4.52 post zooming up on its chart by 6.7% over the past day. Over the last few days, the prices continuously remained sandwiched between $4.52 and $3.89 price levels.
Over the last multiple weeks, Tezos attempted to breach its long-standing resistance level of $5.91, but the bulls did not manage to sustain. If bulls tend to stick around for the upcoming sessions, the local resistance mark was $4.54 and then $5.18.
Tezos: XTZ/USD Four-Hour Chart

After withstanding extreme weakness, the Relative Strength Index managed to rise above the half line into the bullish zone; however, this reading could reverse any moment considering the downtick seen on the indicator. Unless the bulls gather strong momentum, it cannot be ascertained if XTZ would continue with positive price action.
The Directional Movement Index preferred the bulls, although the reading remained quite meek at the time of writing. MACD confirmed bullishness as it registered green histograms. In the likely event of bears taking over, XTZ would fall to trade near the support line of $3.89.
MANA/USD Four-Hour Chart
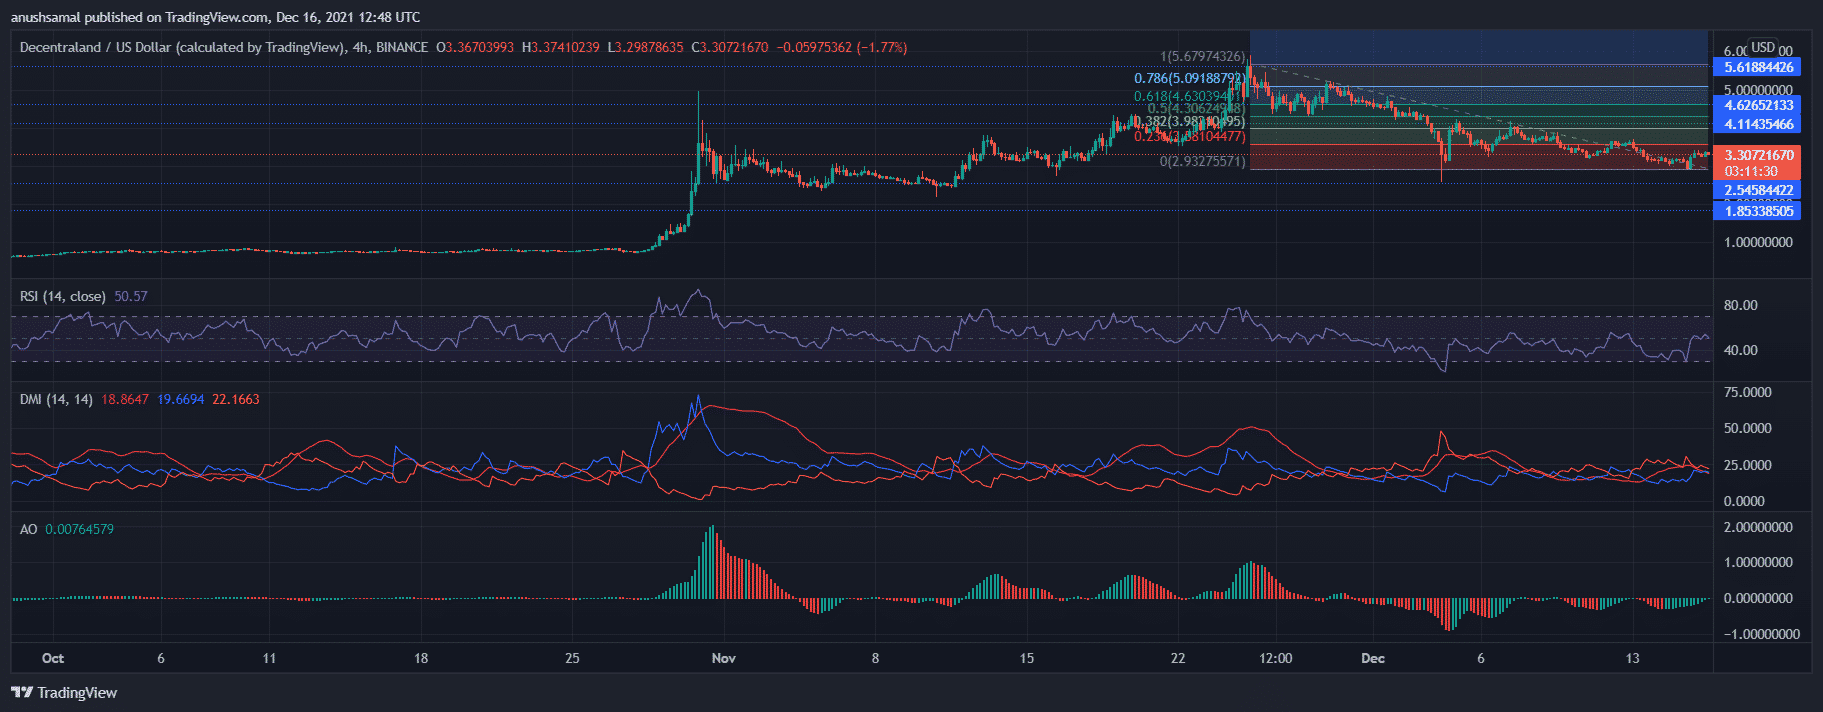
The allure of metaverse tokens had diligently started to fade away. In the case of Decentraland, the token was on a downhill over the past weeks. In the last 24 hours, MANA’s price action transposed into a bullish outcome as the coin rose by 7.7%. At press time, MANA was exchanging hands at $3.30.
The bulls had tried to move past the 38.2% Fibonacci level in the past trading sessions but met with rejections afterward. For MANA to trade at its next price level of $4.11, the bulls need to propel above the aforementioned Fibonacci level.
The Directional Movement Index showed signs of revival as it barely crossed the -DI line. Even though parked into the bullish territory, the Relative Strength Index did not look promising as the indicator noted a downtick is gravitating towards the bears in the market. Awesome Oscillator projected chances of a bearish comeback as the green signal bars declined in size.
VET/USD Four-Hour Chart

VeChain’s bearish gravitation expedited right after the token formed a descending channel over the past few weeks. However, VET’s price action brought respite to traders after a 9.9% appreciation. Indicators turned bullish in sentiment as VET traded for $0.085 at press time. Immediate price resistance that VET could encounter stood at $0.100 and then at $0.115.
On the four-hour timeframe, The Relative Strength Index had struggled to see the bullish side of the midline; however, as prices recovered, the indicator shot right up. The bearish influence was fading out as buyers entered the market. The Directional Movement Index also confirmed the bullish outlook of the coin. On Balance, Volume projected a steady rise in bullish price action.
In case the coin invalidates the bullish theory, it will land on the $0.077 price level.
Play 10,000+ Casino Games at BC Game with Ease
- Instant Deposits And Withdrawals
- Crypto Casino And Sports Betting
- Exclusive Bonuses And Rewards


Why Trust CoinGape
CoinGape has covered the cryptocurrency industry since 2017, aiming to provide informative insights Read more… to our readers. Our journal analysts bring years of experience in market analysis and blockchain technology to ensure factual accuracy and balanced reporting. By following our Editorial Policy, our writers verify every source, fact-check each story, rely on reputable sources, and attribute quotes and media correctly. We also follow a rigorous Review Methodology when evaluating exchanges and tools. From emerging blockchain projects and coin launches to industry events and technical developments, we cover all facets of the digital asset space with unwavering commitment to timely, relevant information.

Delivered every day.
- Insights that move markets
- 100,000 active subscribers
Related Articles


- Peter Brandt Flips Bullish, Predicts Bitcoin Rally As Price Holds Above $70k
- XRP News: Institutional Use Case Expands as Doppler Finance Integrates WXRP for Multi-Chain Access
- Trump Tariffs: Bitcoin Faces Fresh Headwinds as 15% Global Tariffs Begin This Week Amid Iran War
- Bitget Unveils ‘Crypto Anti-Bias Pledge’ To Support Women’s Inclusion In Crypto
- U.S.-Iran War: Crypto Market Rebounds as Iran Reportedly Reaches Out To U.S. To End Conflict
- Dogecoin Price Outlook as BTC Recovers Above $73,000
- XRP Price Prediction as Iran-U.S. Peace Talks Trigger a Crypto Rally
- COIN Stock Analysis as Bitcoin Retests $72k Ahead of February NFP Data
- Robinhood Stock Price Prediction As Cathie Wood Buys $12M Dip in Bold ARK Move
- Bitcoin Price At Risk? Professor Who Predicted US-Iran War Says America Could Lose
- Gold Price Prediction March 2026: Rally, Crash, or Record Highs?


