 Buy $GGs
UMA Technical Analysis: UMA Goes Ballistic, Aims For $15


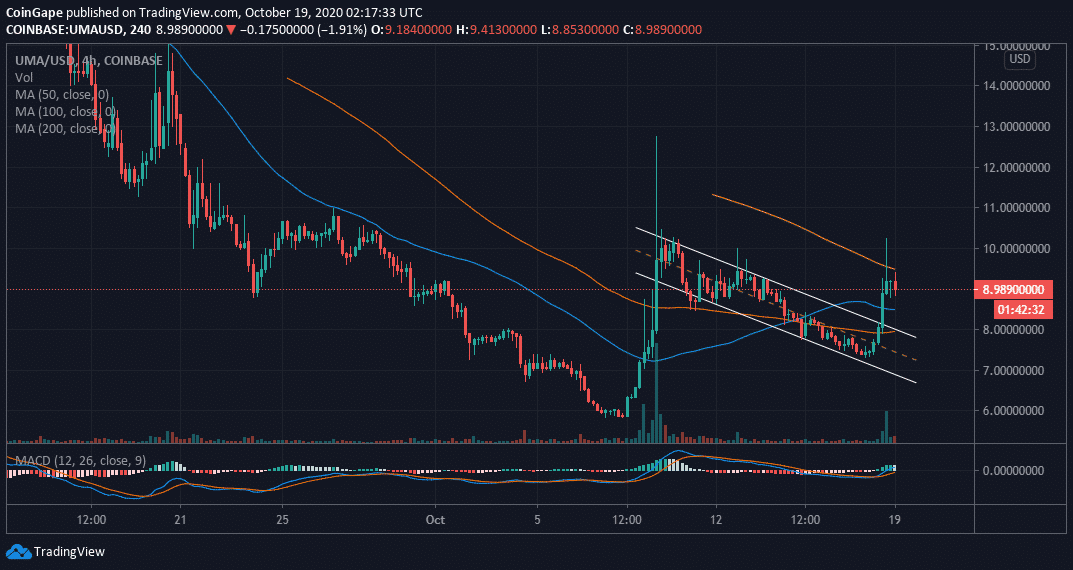
- UMA capitalizes on a bull flag pattern breakout to test resistance at the 200 SMA and $10.
- UMA/USD is doddering between two key levels; the 50 SM and the 200 SMA.
UMA is starting the new week’s trading in style amid a remarkable recovery. Over the last 24 hours, the token accrued more than 20% in gains. It is trading at $9 after running into a barrier at $10.
The recovery commenced with a spike above a bull flag pattern as observed on the 4-hour chart. Support at $7 also played a key role by giving buyers balance and stability to shift their focus to higher levels at $10.
UMA extended the impressive price action above several resistances including $10 and the 200 Simple Moving Average. However, little progress was made above these very hurdles. Looking at the Moving Average Convergence Divergence (MACD), the odds seem to be in the favor of the bulls. Besides crossing into the positive territory, a bullish divergence above the MACD highlights the presence of buying pressure.
UMA/USD 4-hour chart
On the upside, price action above the 200 SMA is required to pave the way for the rest of the gains targeting $15. The resistance at $10 might absorb some buying pressure, in turn, delaying recovery.
It is worth mentioning that the bullish outlook could be invalidated if a reversal occurred below the 50 SMA. However, support is envisaged at $8 and $7 respectively. For now, the two key levels took watch are the 200 SMA resistance and the 50 SMA support.
UMA Intraday Levels
Spot rate: $9
Relative change: -0.2
Percentage change: -1.8
Trend: Bullish
Volatility: Low
Play 10,000+ Casino Games at BC Game with Ease
- Instant Deposits And Withdrawals
- Crypto Casino And Sports Betting
- Exclusive Bonuses And Rewards


Why Trust CoinGape
CoinGape has covered the cryptocurrency industry since 2017, aiming to provide informative insights Read more… to our readers. Our journal analysts bring years of experience in market analysis and blockchain technology to ensure factual accuracy and balanced reporting. By following our Editorial Policy, our writers verify every source, fact-check each story, rely on reputable sources, and attribute quotes and media correctly. We also follow a rigorous Review Methodology when evaluating exchanges and tools. From emerging blockchain projects and coin launches to industry events and technical developments, we cover all facets of the digital asset space with unwavering commitment to timely, relevant information.

Delivered every day.
- Insights that move markets
- 100,000 active subscribers
Related Articles


- Senate Eyes CLARITY Act Markup This Month as Banks, Crypto Continue Stablecoin Yield Talks
- Why XRP Price Rising Today? (2 March)
- Breaking: Bitcoin Price Rises to $70k as Gold Crashes Amid U.S.-Iran Conflict
- Bitcoin News: Anthony Pompliano’s ProCap Buys 450 BTC, Gold Bug Peter Schiff Reacts
- Fed Rate Cuts More Likely If U.S.-Iran Conflict Extends, Arthur Hayes Predicts
- Top 5 Historical Reasons Dogecoin Price Is Not Rising
- Pi Coin Price Prediction for March 2026 Amid Network Upgrade, KYC Boost, Rewards Distribution
- Gold Price Nears ATH; Silver Eyes $100 Breakout on Us- Iran War
- Bitcoin And XRP Price As US Kills Iran Supreme Leader- Is A Crypto Crash Ahead?
- Gold Price Prediction 2026: Analysts Expect Gold to Reach $6,300 This Year
- Circle (CRCL) Stock Price Prediction as Today is the CLARITY Act Deadline


