 Buy $GGs
XRP Price 3% Breakout Sparks Hope For $1


XRP price downtrend from the Ripple ruling triggered rally early last month to $0.93, has continued to kill investor sentiment, with declines stretching to $0.60. However, with support at this level seemingly intact and XRP testing resistance at $0.65, there is a glaring possibility of gains extending to $0.7 and $1, respectively.
XRP Price Eyes Bullish Breakout As SEC-Ripple Hype Fades
Many investors anticipated a massive breakout following the partial ruling in the Ripple vs. SEC lawsuit, which determined that XRP is not a security when sold on third-party exchanges like Coinbase and Binance.
Although the initial breakout propelled XRP price to $0.93, profit-booking and a dilapidated crypto market environment saw gains to trimmed to $0.60.
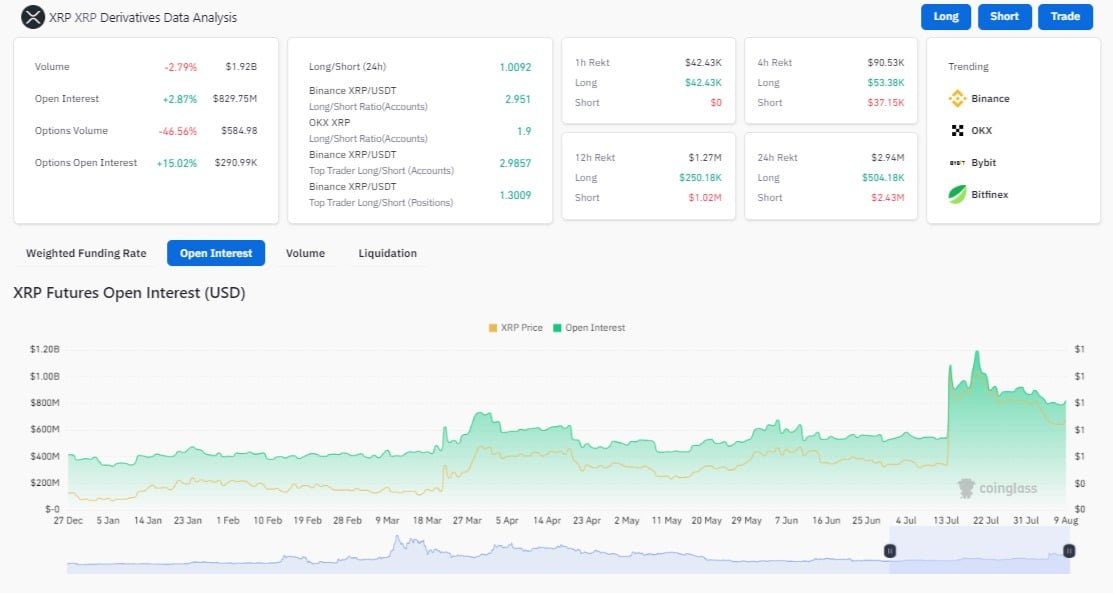
Data by Coinglass on the XRP derivatives market reveals a drop in open interest to $786.81 million from slightly above $1 billion around mid-July.
Based on on-chain data from the XRPSCAN, daily network transactions have continued to move sideways around $1 million for at least 12 months, implying that the cross-border payments token has not improved fundamentally.
How To Profitably Navigate Current XRP Market Structure
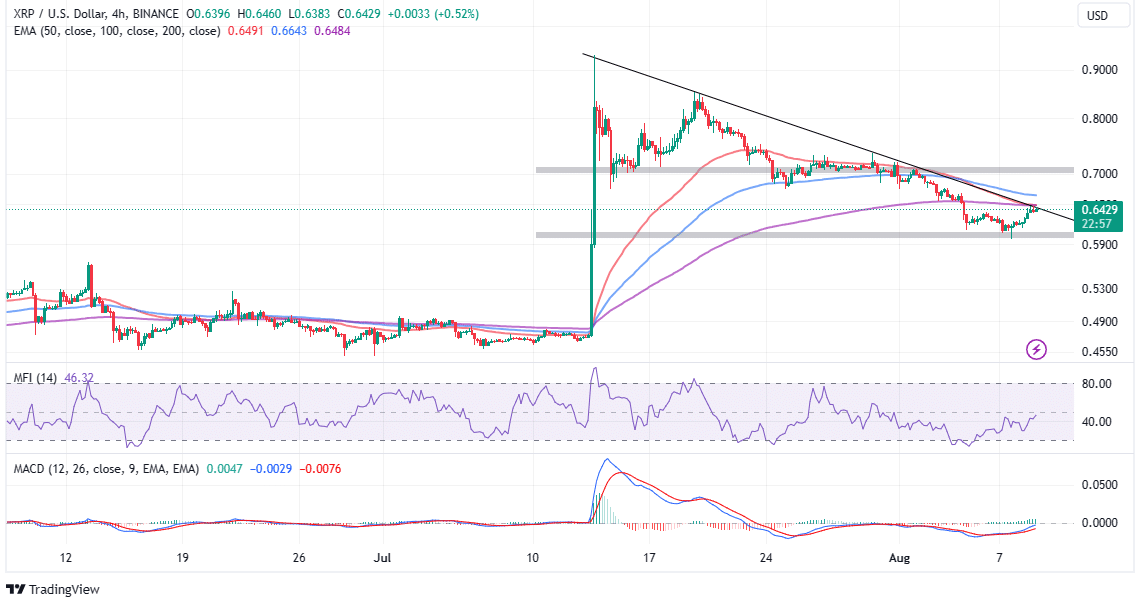
Based on the prevailing market structure, XRP price is poised to rally – first to $0.7 where consolidation may take place ahead of the ultimate rally above $1.
Traders seeking exposure to XRP longs may want to hold on until the price breaks above the descending trendline on the four-hour chart, which marks a confluence resistance at $0.6484 with the 200-day Exponential Moving Average (EMA).
The path with the least resistance could remain to the upside for the rest of the week, bolstered by the positive outlook of the Moving Average Convergence Divergence (MACD) and the Money Flow Index (MFI), which have been trending upward since late last week.
The MACD dons a buy signal following a bullish cross while the MFI shows that investors are open to seeking exposure to XRP markets.
Although the technical picture on the daily chart is slightly different, it validates the bullish outlook. For instance, the 50-day EMA (red) reinforced support at $0.6. If declines soar, the 100-day EMA (blue) at $0.57 and the 200-day EMA (purple) at $0.52 will come in handy.
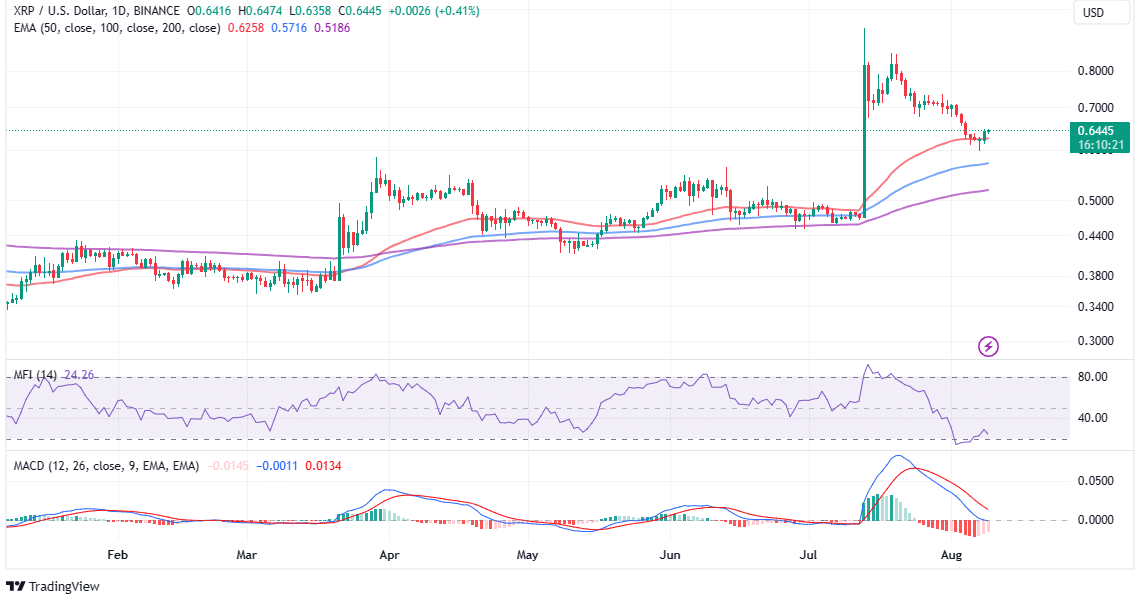
Traders must, however, be cautious keeping in mind the sell signal as presented by the MACD. Besides, the MFI reveals outflows from XRP markets fall behind the inflow volume.
In that case, failure to extend the uptrend above $0.7 could challenge the bulls’ position in the market and thus exert more pressure on the support areas highlighted above.
Related Articles
- XRP Defies CoinGecko’s SEC Security Token List, Ripple CTO And Lawyer Reacts
- Shiba Inu Lead Developer Hints At Imminent Shibarium Mainnet Release
- Shiba Inu Lead Developer Hints At Imminent Shibarium Mainnet Release
Play 10,000+ Casino Games at BC Game with Ease
- Instant Deposits And Withdrawals
- Crypto Casino And Sports Betting
- Exclusive Bonuses And Rewards


Why Trust CoinGape
CoinGape has covered the cryptocurrency industry since 2017, aiming to provide informative insights Read more… to our readers. Our journal analysts bring years of experience in market analysis and blockchain technology to ensure factual accuracy and balanced reporting. By following our Editorial Policy, our writers verify every source, fact-check each story, rely on reputable sources, and attribute quotes and media correctly. We also follow a rigorous Review Methodology when evaluating exchanges and tools. From emerging blockchain projects and coin launches to industry events and technical developments, we cover all facets of the digital asset space with unwavering commitment to timely, relevant information.

Delivered every day.
- Insights that move markets
- 100,000 active subscribers
Related Articles


- Crypto Market Bill Hits New Deadlock as Banks Reject White House Deal
- Why Experts Are Warning Bitcoin Rally Could Be A “Dead Cat Bounce”
- BTC and Gold Price Bounce as Trump Admin Brokers US-Venezuela 1000 Kg Gold Deal
- SEC Advances Major Crypto Securities Plan to White House for Approval
- Peter Brandt Flips Bullish, Predicts Bitcoin Rally As Price Holds Above $70k
- XRP Price As Bitcoin Reclaims $74K- Is $5 Next?
- Dogecoin Price Outlook as BTC Recovers Above $73,000
- XRP Price Prediction as Iran-U.S. Peace Talks Trigger a Crypto Rally
- COIN Stock Analysis as Bitcoin Retests $72k Ahead of February NFP Data
- Robinhood Stock Price Prediction As Cathie Wood Buys $12M Dip in Bold ARK Move
- Bitcoin Price At Risk? Professor Who Predicted US-Iran War Says America Could Lose


