 Buy $GGs
XRP, Terra and NEM Price Analysis: 08 December


The price of XRP has been consolidating above its critical support of $0.74 for a considerable while now. At press time XRP was priced at $0.87 and it registered a gain of 4.7% over the past day. Immediate resistance for the coin rested at $0.96 and then at $1.05 which the coin hasn’t gone past in the past couple of weeks. Technicals indicate that the bulls have taken charge of the prices.
XRP/USD Chart In The 4-hour Time Frame
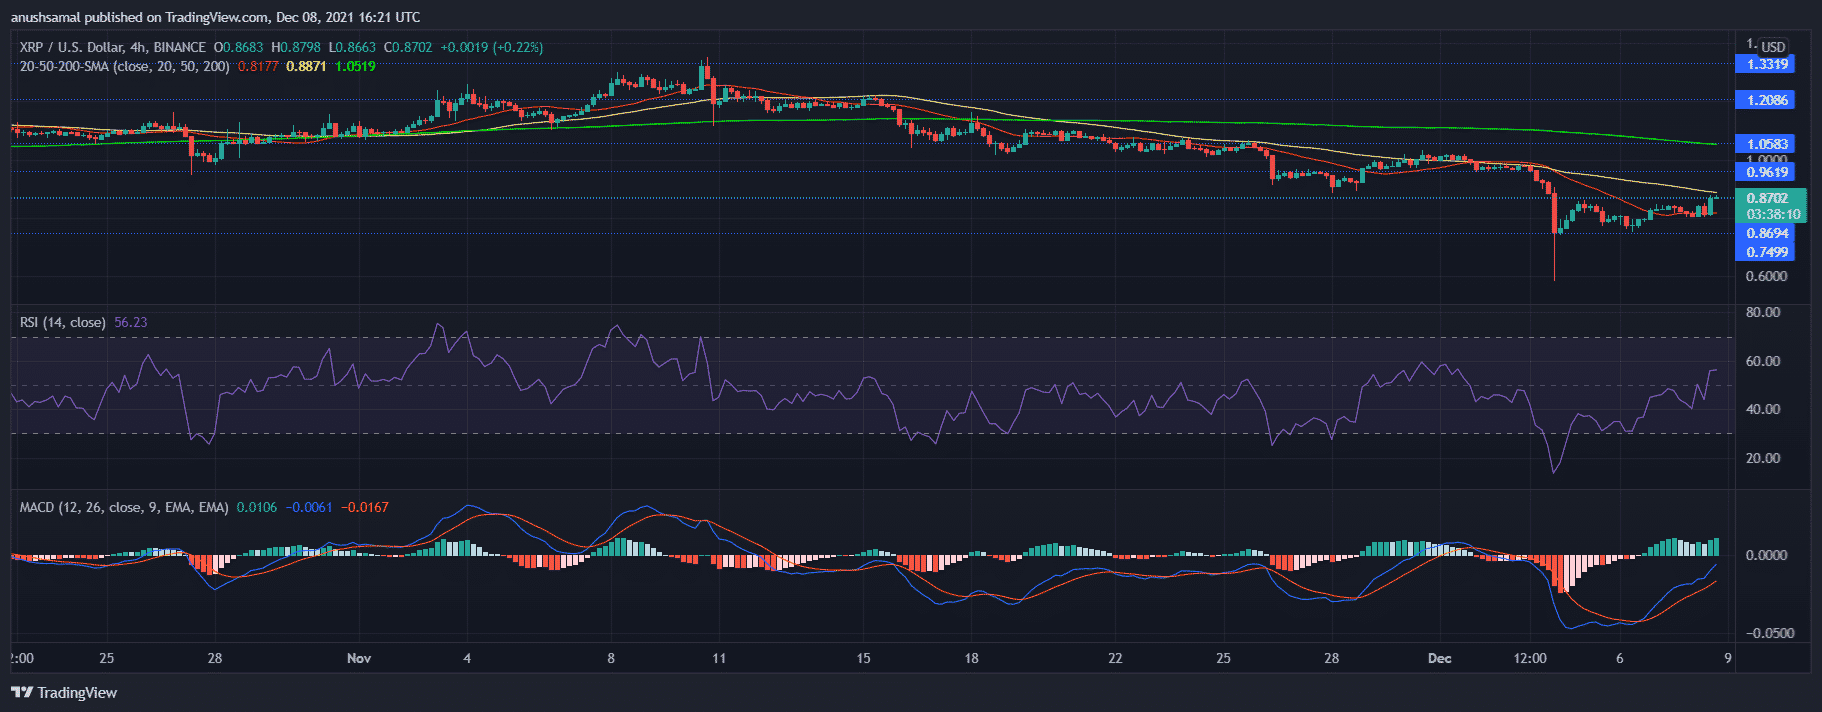
The Relative Strength Index has finally moved above the half-line into a bullish territory which meant that buyers have exceeded sellers in the market. Ever since December 4, the indicator has remained in the bearish zone.
The price of XRP was above the 20-SMA line which indicated that the price momentum was in favour of the buyers, also suggesting that the downtrend has weakened.
MACD underwent a bullish crossover and depicted amplified green histograms that implied positive price action over the immediate trading sessions.
On the flip side, XRP’s support region stood at $0.86 and then at $0.74.
LUNA/USD Chart In The 4-hour Time Frame
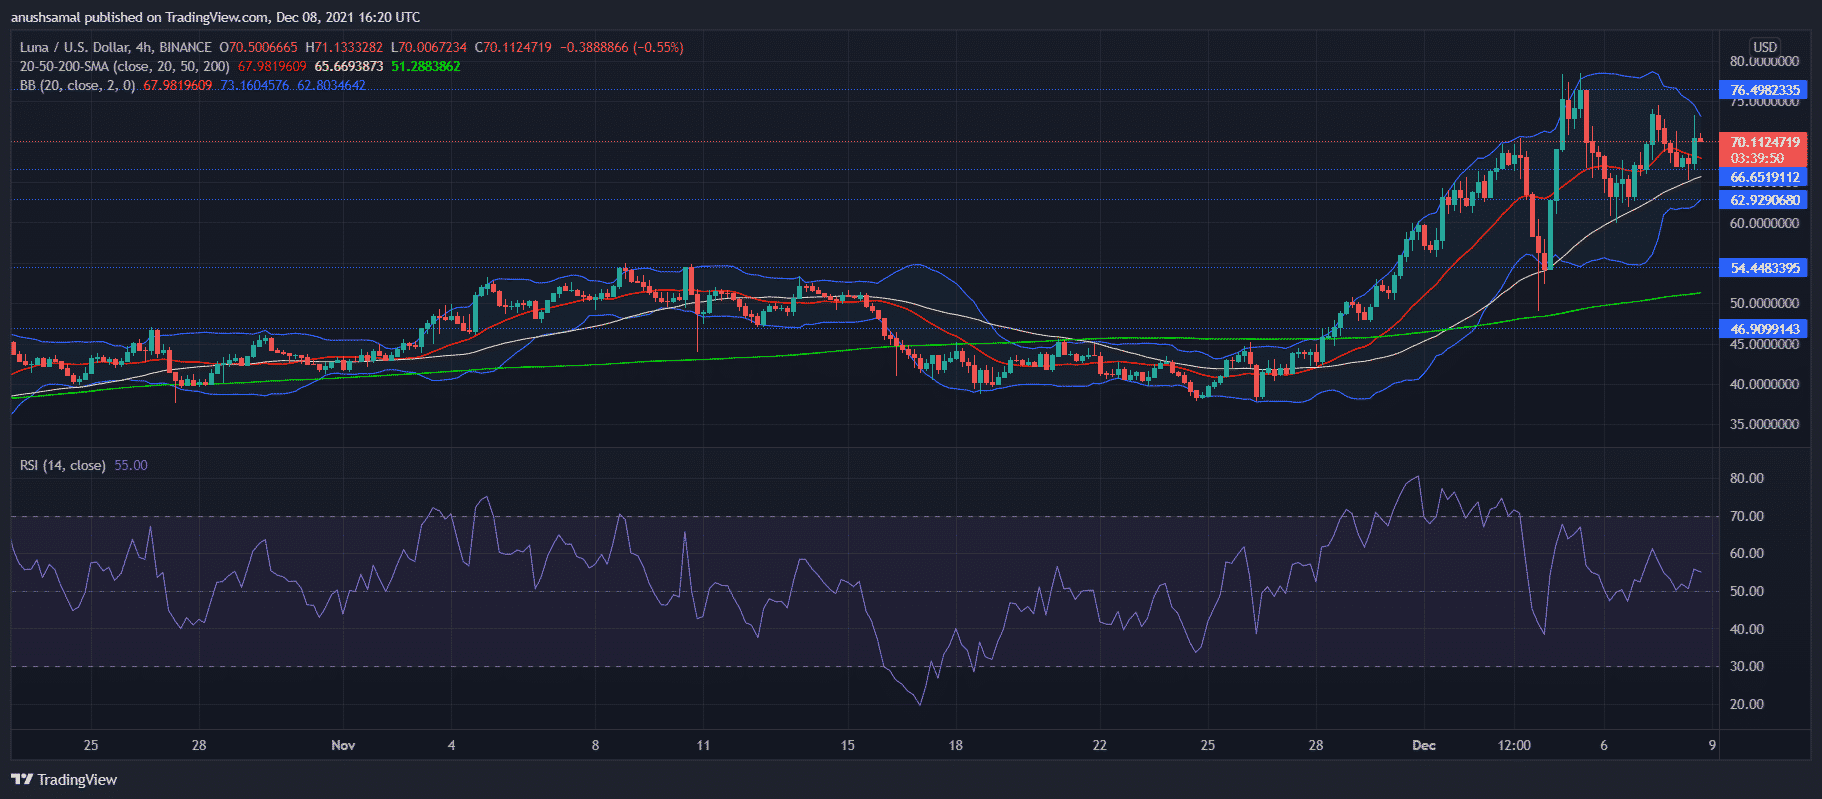
Terra over the last week has been making gains, it was up by 19.7%. At the time of writing, the token was trading for $70.11 with its immediate price ceiling at $76.49. The technical outlook for Terra also indicated that the bulls had taken over.
Bollinger Bands has constricted slightly, indicating that the volatility of LUNA might remain in control over the next trading sessions. Prices were spotted above the 20-SMA line which meant that LUNA was on a short-term uptrend.
In regards to uptrend, The Relative Strength Index was also positive as buyers exceeded sellers.
XEM/USD Chart In The 4-hour Time Frame
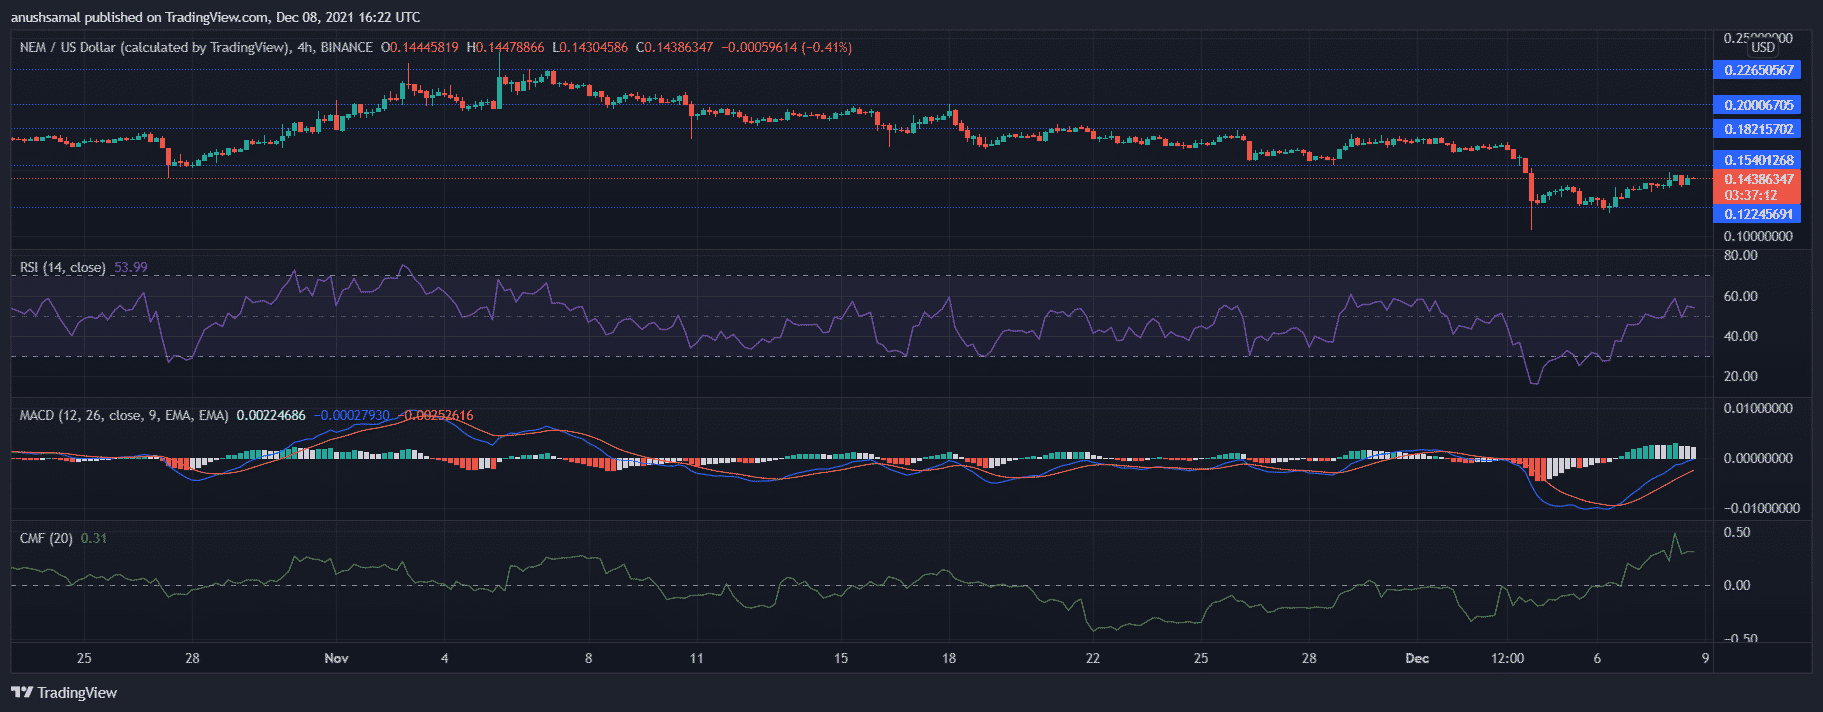
NEM reversed its one-week losses by registering a 4.5% gain over the last 24 hours. The immediate resistance for the coin was at $0.15 and then at $0.18 which NEM struggled to break above since the past few weeks. Other price ceilings for the coin was at $0.20 and $0.22.
Relative Strength Index was parked above the half-line into the bullish zone as buyers exceeded sellers in the market. Capital inflows have been on a multi-month high as seen on the Chaikin Money Flow.
MACD underwent a bullish crossover indicating positive price action. On the reverse side, in case the coin fails to move ahead with the resistance level of $0.15, the coin would end up trading near its support line of $0.12.
Play 10,000+ Casino Games at BC Game with Ease
- Instant Deposits And Withdrawals
- Crypto Casino And Sports Betting
- Exclusive Bonuses And Rewards


Why Trust CoinGape
CoinGape has covered the cryptocurrency industry since 2017, aiming to provide informative insights Read more… to our readers. Our journal analysts bring years of experience in market analysis and blockchain technology to ensure factual accuracy and balanced reporting. By following our Editorial Policy, our writers verify every source, fact-check each story, rely on reputable sources, and attribute quotes and media correctly. We also follow a rigorous Review Methodology when evaluating exchanges and tools. From emerging blockchain projects and coin launches to industry events and technical developments, we cover all facets of the digital asset space with unwavering commitment to timely, relevant information.

Delivered every day.
- Insights that move markets
- 100,000 active subscribers
Related Articles


- Crypto Traders Bet Against U.S.-Iran Ceasefire This Month as Iran Denies Peace Talks
- Ripple Prime Adds Support For Bitcoin, Ethereum, XRP, Solana Derivatives on Coinbase
- Bitcoin Price Still Risks Decline If Iran War Mirrors Ukraine War Market Reaction, JPMorgan Warns
- Bitget Unveils Upgrade For Stock, Gold Trading Alongside Crypto As Part Of Universal Exchange Push
- ChangeNOW Is Settling Crypto Swaps in Under a Minute.
- Bitcoin Price Prediction if Donald Trump Signs the CLARITY Act on April 3, 2026
- Pi Network Price As BTC Rallies Above $74K: Can PI Coin Extend Gains to $0.30?
- XRP Price As Bitcoin Reclaims $74K- Is $5 Next?
- Dogecoin Price Outlook as BTC Recovers Above $73,000
- XRP Price Prediction as Iran-U.S. Peace Talks Trigger a Crypto Rally
- COIN Stock Analysis as Bitcoin Retests $72k Ahead of February NFP Data


