


Is LUNC Price Set for $0.00009? Triangle Pattern Signals a 10% Rise Ahead


Amidst a prevailing bearish sentiment in the crypto market, the LUNC price witnessed a corrective phase over the past two weeks. Starting from its peak of $0.0000968, the coin has experienced a significant 15% decline, settling at its current trading price of $0.0000818. However, the price trend turned sideways after hitting the bottom demand zone of $0.0000793 and $0.000078. This consolidation reflects uncertainty among the market participants and questions the possibility of a bullish reversal.
Also Read: Expert Predicts 400% Jump For Terra Classic (LUNC) Price; Here’s Timeframe
LUNC Price Daily Chart
- The narrow range between the triangle pattern can be considered a no-trading zone
- A bullish breakout from the triangle pattern will set the LUNC price at a 10% Jump
- The intraday trading volume in the LUNC coin is $13.9 Million, indicating a 14% loss.
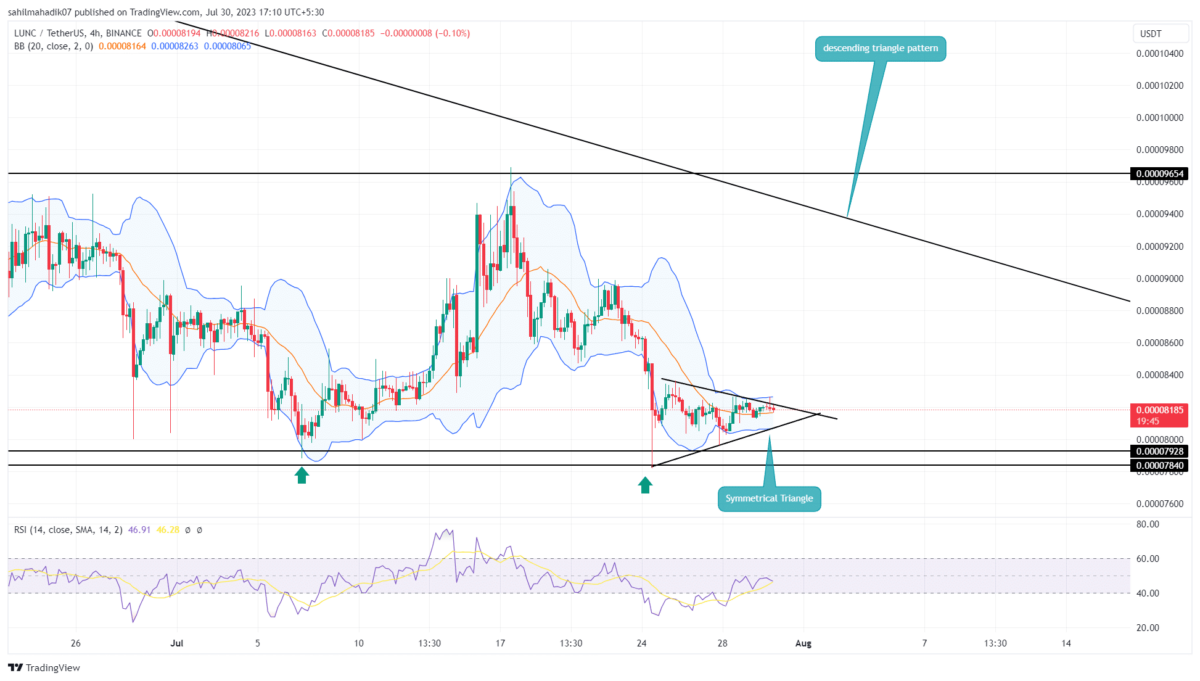
 Source- Tradingview
A closer look at the four-hour time frame chart shows the ongoing consolidation has shaped into a symmetrical triangle pattern. This pattern is characterized by a series of lower highs and higher lows, which create converging trendlines, giving the appearance of a triangle.
By press time, the LUNC price is trading at $0.0000819 and is steadily approaching the peak of the symmetrical triangle pattern. The fact that the price range has become narrower indicates that the coin price is about to experience a significant breakout.
If the coin price gives a bullish breakout from the overhead trendline, the crypto holders could witness a bullish reversal in a higher timeframe chart. This potential reversal has the potential to surge the price by as much as 10%, effectively challenging the overhead resistance trendline.
Will LUNC Price Plunge Back to $0.00007?
The symmetrical triangle pattern usually encourages the continuation of prevailing trends. Therefore a breakdown of this support line of the triangle pattern could encourage sellers to break the multi-month bottom support of $0.0000793 and $0.000078. The post-breakdown fall could tumble are altcoin to $0.00007.
- Relative strength index: A significant rise in the daily RSI slope indicate the increasing buying pressure at the bottom support and a higher possibility of an upside breakout
- Bollinger band: The narrow range of the Bollinger band indicator reflects a highly volatile phase in LUNC price.
Instant Currency Exchange at BestChange with Ease
- Compare Rates Across 1000+ Exchanges
- Access 250+ Cryptocurrencies & Pairs
- Save Time with Real-Time Price Tracking


Why Trust CoinGape
CoinGape has covered the cryptocurrency industry since 2017, aiming to provide informative insights Read more…to our readers. Our journal analysts bring years of experience in market analysis and blockchain technology to ensure factual accuracy and balanced reporting. By following our Editorial Policy, our writers verify every source, fact-check each story, rely on reputable sources, and attribute quotes and media correctly. We also follow a rigorous Review Methodology when evaluating exchanges and tools. From emerging blockchain projects and coin launches to industry events and technical developments, we cover all facets of the digital asset space with unwavering commitment to timely, relevant information.


