
Hedera Price Analysis: Bullish Reversal From Support Sparks 24% Recovery Rally


A bullish reversal from the support trendline hints HBAR price to prolong the recovery trend. Defying the broader market bearishness, the Hedera Hashgraph shows a strong rebound from the ascending support trendline and maintaining its overall bullish outlook. Over the past two months, the crypto buyers have obtained dynamic support from this trendline offering an opportunity to accumulate at dips. Should you buy this altcoin despite bearish winds?
Also Read: HBAR On The Rise? Why Bone ShibaSwap And Everlodge Are Still Winning Hearts
HBAR Price Chart: Key Points
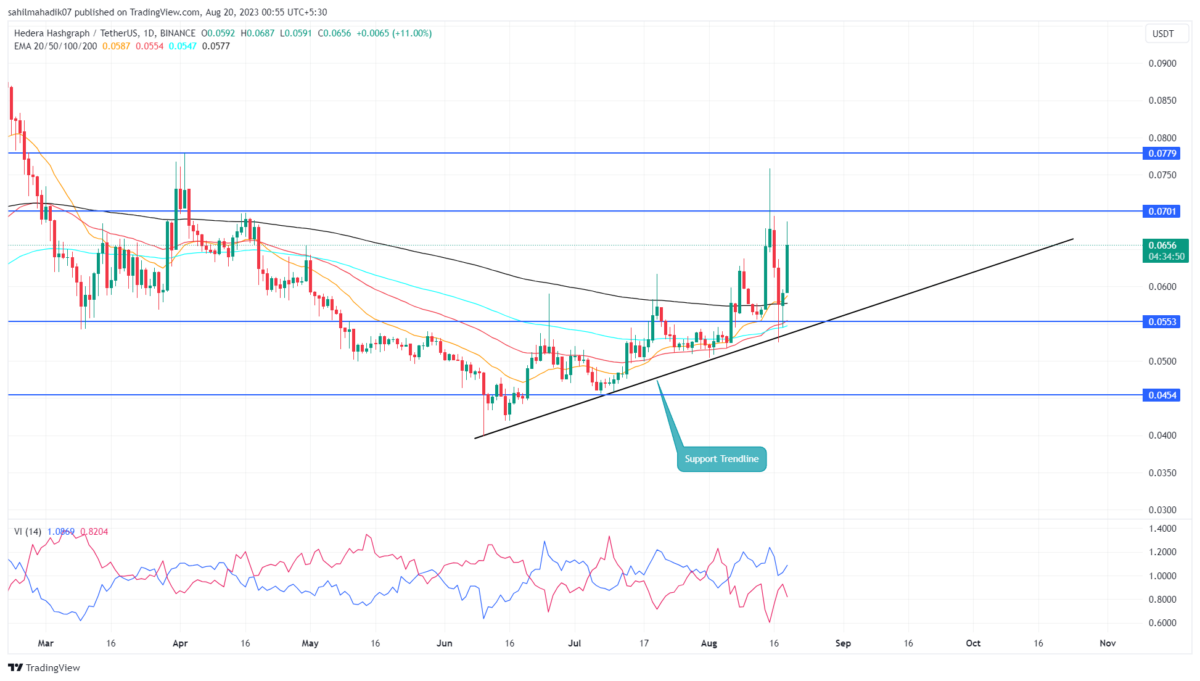
- An ascending trendline governs the current recovery rally in the Hedera hashgraph.
- A golden crossover between 50-and-200-day EMA encourages buyers for extending the recovery rally
- The intraday trading volume in the HBAR is $236.2 Million, indicating a 131% gain.
 Source-Tradingview
Amid the rising bearishness in the crypto market, HBAR recovery rally entered a correction mode after reaching a high of $0.0759. This pullback tumbled the prices by 30% and retested the two-month-long support trendline.
Despite the negative sentiment in the market, Hedera Hashgraph buyers gave a strong rebound, signaling the buyers continue to accumulate this asset at dips, which is a sign of an established uptrend. So far the bullish swing recovered 24% reaching the current trading value of $0.0656.
With sustained buying, the coin price could rise to potential targets of $0.7, followed by $0.78, and $0.988.
Is HBAR Price Still Under Correction Threat?
The daily time frame chart shows the Hedera coin may prolong the current recovery cycle until the ascending support trendline is intact. With each pullback to this trendline, interested buyers can look for entry opportunities, however, considering a pessimistic approach, if sellers breach the lower trendline, the aforementioned bullish thesis will get invalidated. This breakdown could push the prices to $0.45 local support.
- Exponential Moving Average: The HBAR price sustainability above the 200-day EMA reflects the overall trend as bullish.
- Vortex Indicator: A positive crossover state between the VI+(blue) and VI-(orange) indicates the market trend supports recovery

Why Trust CoinGape
CoinGape has covered the cryptocurrency industry since 2017, aiming to provide informative insights Read more…to our readers. Our journal analysts bring years of experience in market analysis and blockchain technology to ensure factual accuracy and balanced reporting. By following our Editorial Policy, our writers verify every source, fact-check each story, rely on reputable sources, and attribute quotes and media correctly. We also follow a rigorous Review Methodology when evaluating exchanges and tools. From emerging blockchain projects and coin launches to industry events and technical developments, we cover all facets of the digital asset space with unwavering commitment to timely, relevant information.


- Monero Privacy Demand Hits Record Highs: How GhostSwap Is Meeting the BTC to XMR Surge
- Goldman Sachs Defies Oil Surge with Bold 2026 Fed Rate Cut Forecast
- Bitcoin Risks Fall as US-Israel Strikes Iran’s Energy Facilities Despite Trump’s 5-Day Pause
- Crypto Leaders Call Stablecoin Yield Text Language in CLARITY Act as “Restrictive”
- FUNToken 2026-2027 Roadmap: Gaming Launch, AI Agent Economy & Tokenized Pokémon cards Collectibles
- Bittensor (TAO) Price Soars 80% MoM Outperforming Bitcoin- Is It A Good Time to Buy?
- Top Factors Behind Shiba Inu (SHIB) Price Surging Today
- Gold Vs BTC: Bitcoin Outperforms Gold by 23% – Is $75K Next Amid Trump’s Five Day Pause
- Crypto Stocks to Watch As Trump Issues 48-Hour Iran Ultimatum- CRCL, COIN, and MSTR Price Analysis
- XRP Price Prediction Ahead of March 27 SEC Spot ETF Decision
- Will Solana Price Recover This Week Amid New SEC/CFTC Crypto Rules?


