BTC Price Analysis: Death Crossover Brings Nightmares On Satoshi Street; Is This A Buying Opportunity?


Bitcoin (BTC) price had discounted nearly 40% when the price dropped to the $40000 support. The coin is under the influence of a falling channel pattern, leading to this correction rally. Moreover, the technical chart shows the 50 and 200 DMA can soon provide a death crossover, boasting the bearish sentiment among market participants.
Key technical points:
- The BTC price provides at a death crossover of the 50-and-200-day DMA
- The intraday trading volume in the BTC coin is $18.27 Billion, indicating a 0.3% fall.
 Source- Tradingview
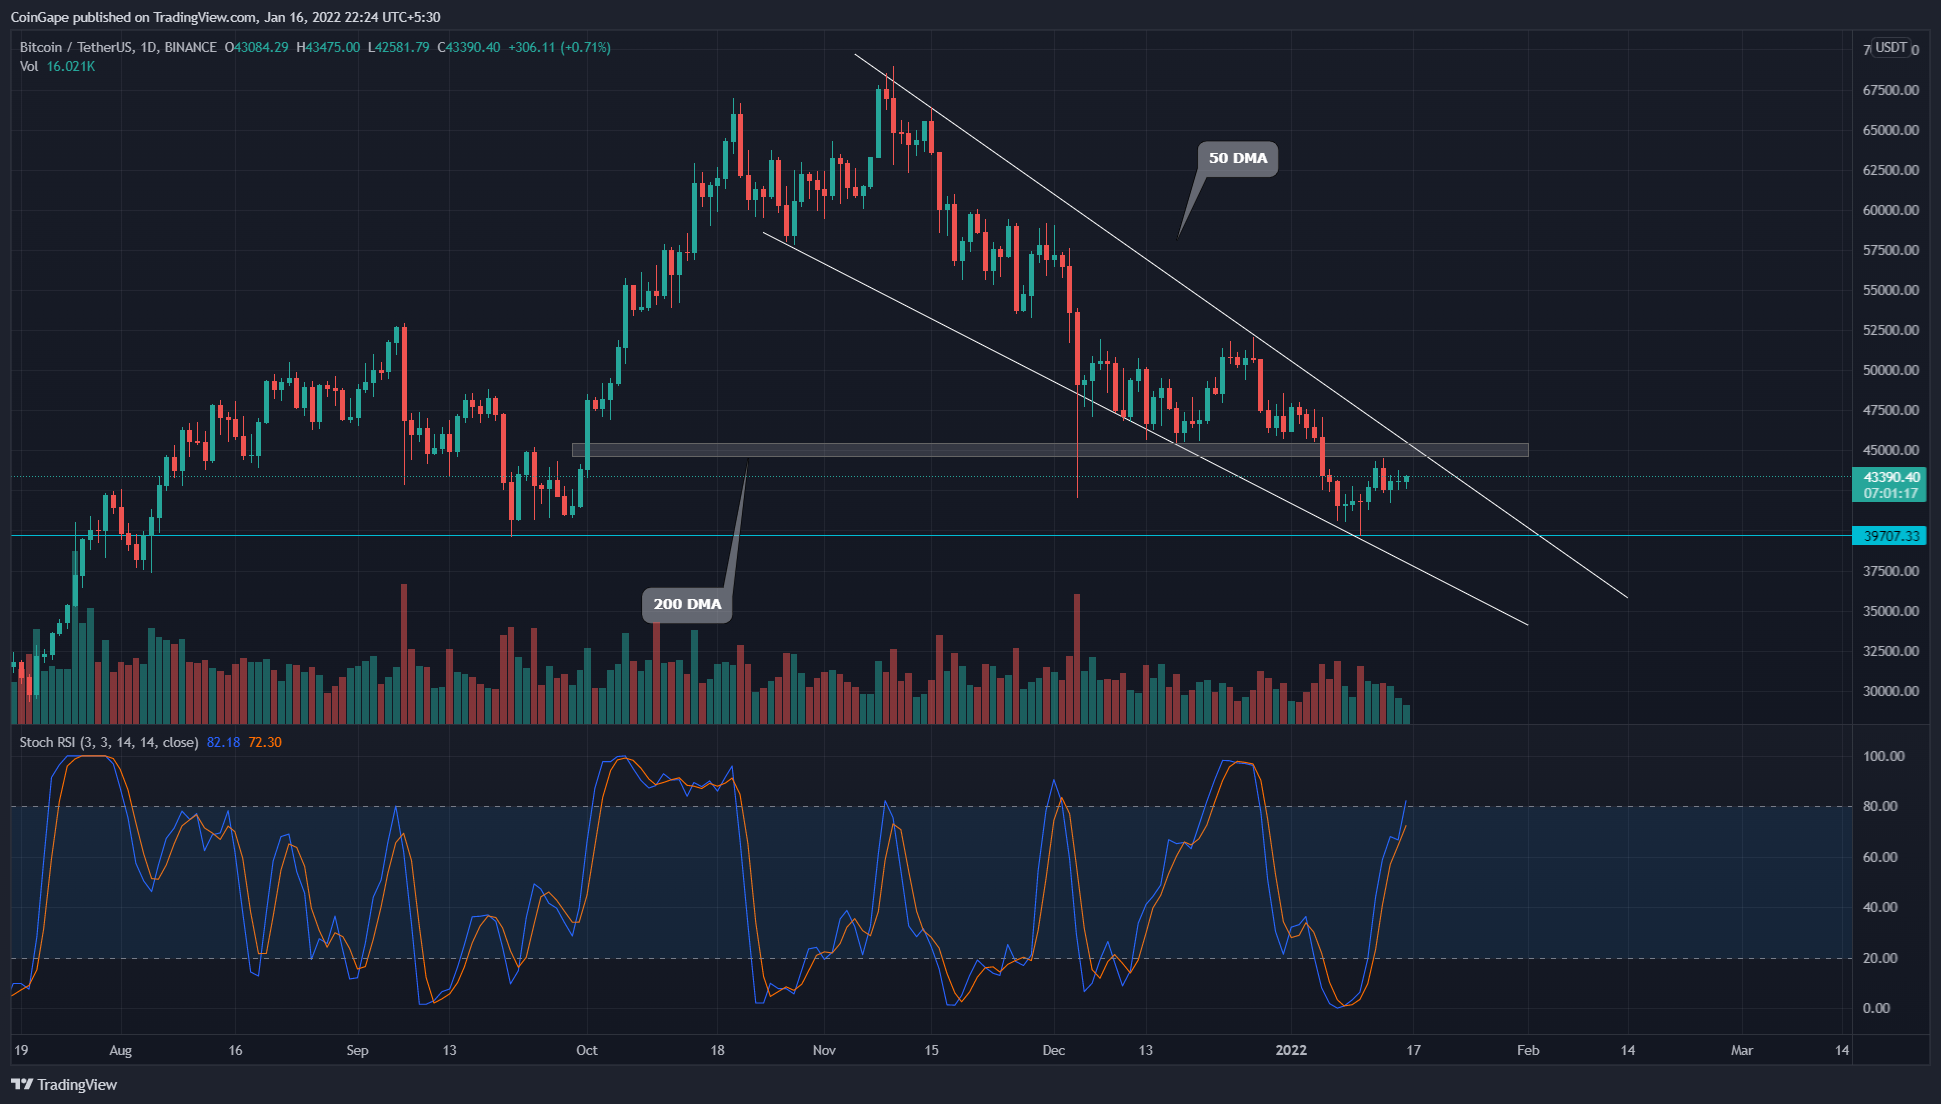
As mentioned in our previous coverage of Bitcoin price analysis, the coin price resonates in a falling channel pattern of the daily time frame chart. This pattern initiated way back in November 2021 and is still extending the correction phase.
This down rally made a new lower low at a psychological level of $40000. The price identified strong support from this level, indicating reversal signs in price action.
As per the crucial EMAs(20, 50, 100, and 200), the BTC coin price trading below the trend defining 100 and 200 EMA, indicates a bearish trend. Moreover, the technical chart shows the 50 and 200 DMA a death cross, attracting even more sellers in the market.
However, the Daily-Stochastic RSI shows a bullish crossover of the K and D lines and is steadily rising towards the higher level.
BTC Price Chart Shows A Cup And Handle Bottom Pattern
 Source- Tradingview
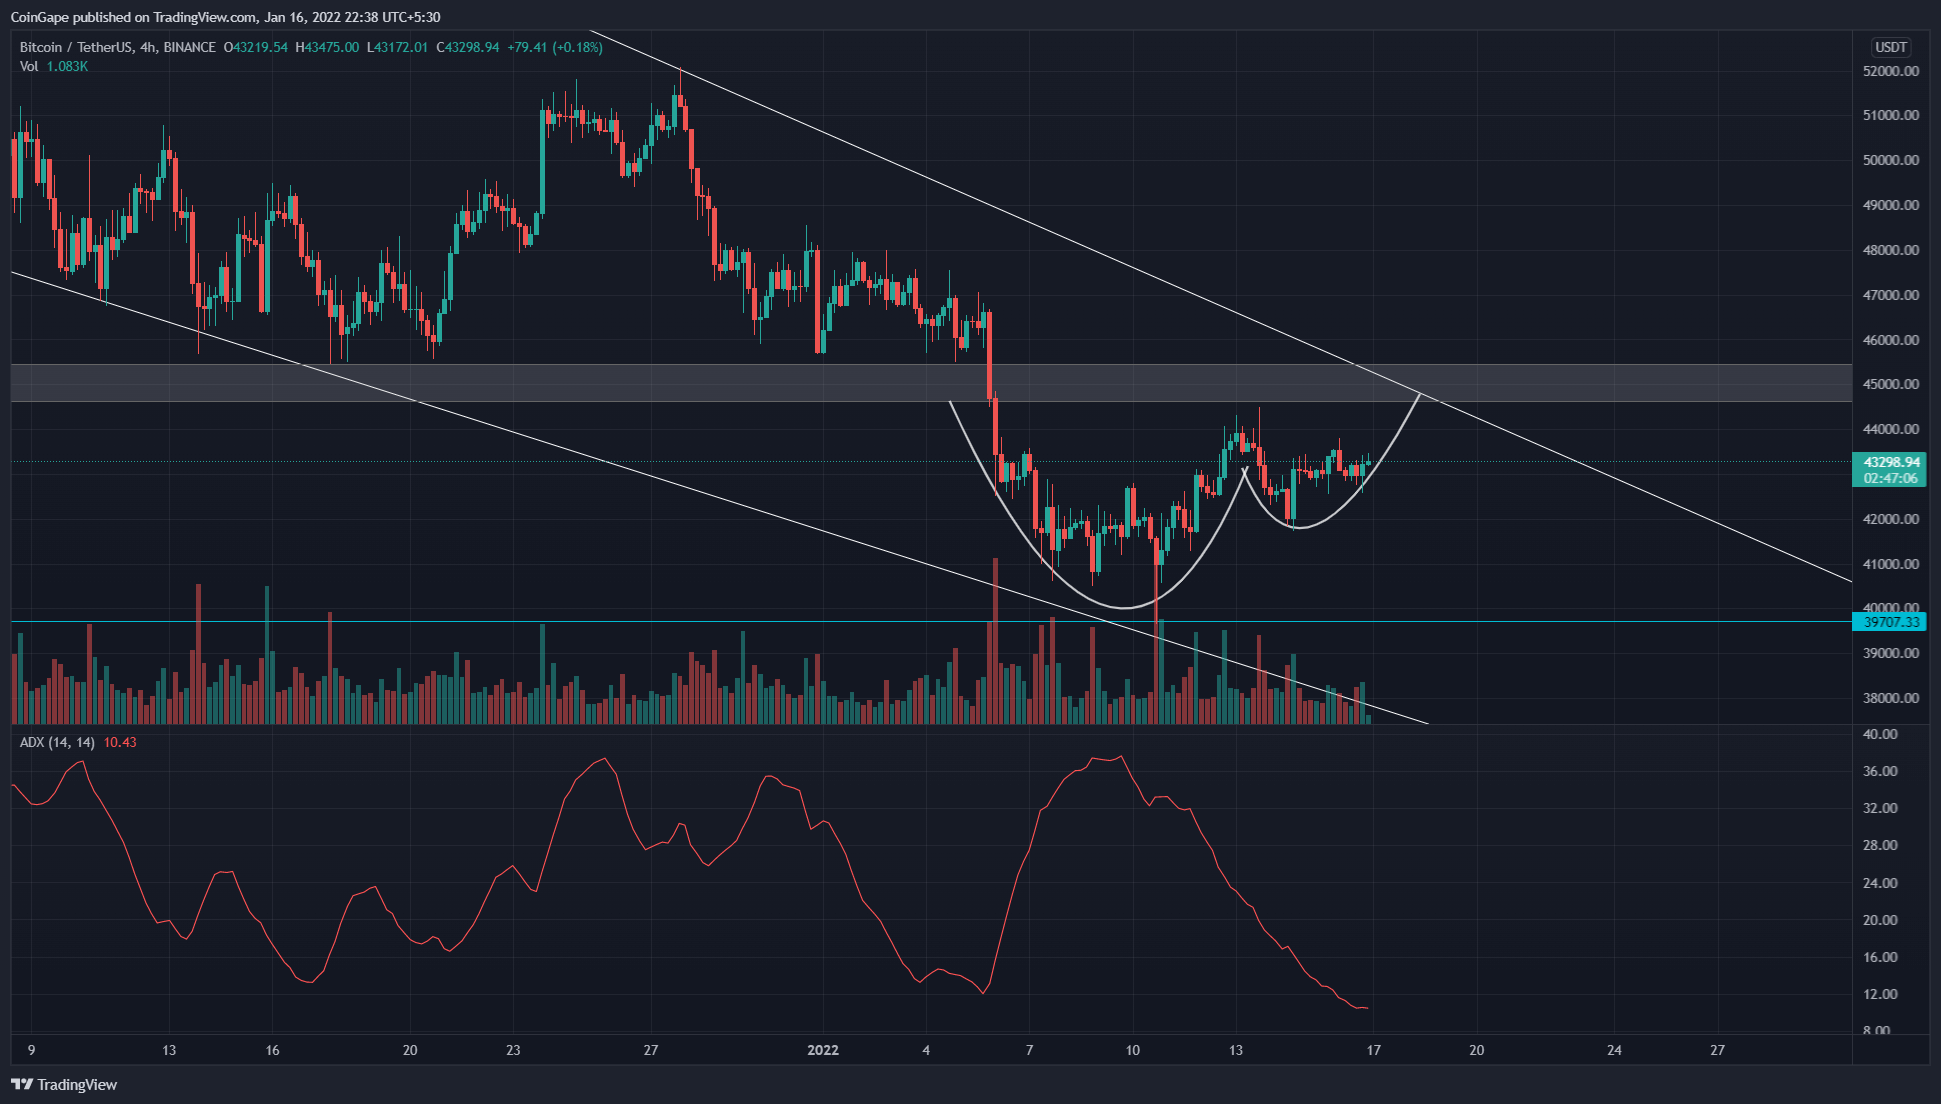
The BTC price is currently trading at $43367, indicating a 9.17% pump from the bottom support. This minor bullish reversal has formed a cup and handle pattern in the 4-hour time frame chart. The resistance zone(neckline) for this pattern is around the $45000 mark, holding an excellent long opportunity for crypto traders.
Moreover, completing this bullish pattern, the coin price would also breach the resistance trendline of the falling channel, initiating a recovery rally.
The falling average directional movement index(34) line signals the decreasing bearish momentum in the price.
- Resistance levels- $45000 and $48000
- Support levels- $42500 and $40000

Why Trust CoinGape
CoinGape has covered the cryptocurrency industry since 2017, aiming to provide informative insights Read more… to our readers. Our journal analysts bring years of experience in market analysis and blockchain technology to ensure factual accuracy and balanced reporting. By following our Editorial Policy, our writers verify every source, fact-check each story, rely on reputable sources, and attribute quotes and media correctly. We also follow a rigorous Review Methodology when evaluating exchanges and tools. From emerging blockchain projects and coin launches to industry events and technical developments, we cover all facets of the digital asset space with unwavering commitment to timely, relevant information.

Delivered every day.
- Insights that move markets
- 100,000 active subscribers
Related Articles


- Bitcoin vs Gold Feb 2026: Which Asset Could Spike Next?
- Top 3 Reasons Why Crypto Market is Down Today (Feb. 22)
- Michael Saylor Hints at Another Strategy BTC Buy as Bitcoin Drops Below $68K
- Expert Says Bitcoin Now in ‘Stage 4’ Bear Market Phase, Warns BTC May Hit 35K to 45K Zone
- Bitcoin Price Today As Bulls Defend $65K–$66K Zone Amid Geopolitics and Tariffs Tensions
- COIN Stock Price Prediction: Will Coinbase Crash or Rally in Feb 2026?
- Shiba Inu Price Feb 2026: Will SHIB Rise Soon?
- Pi Network Price Prediction: How High Can Pi Coin Go?
- Dogecoin Price Prediction Feb 2026: Will DOGE Break $0.20 This month?
- XRP Price Prediction As SBI Introduces Tokenized Bonds With Crypto Rewards
- Ethereum Price Rises After SCOTUS Ruling: Here’s Why a Drop to $1,500 is Possible


