ADA Price Prediction: Cardano Rally In 2023 Boils Down To This Support


ADA price has stabilized following a gruesome August characterized by declines from highs around $0.31 to the major support at $0.25. The smart contracts token has over the last three weeks been confined within a range, with the upper limit at $0.275.
Notably, Cardano live price currently dances within a narrower range channel with the same support but is capped at $0.26.
ADA Price Nurses Losses Ahead of Breakout
Holding above support at $0.25 has helped stabilize ADA price for the last three weeks. Several attempts have been made to weaken the wider range limit but bulls have lacked the momentum to sustain the uptrend.
Sideways trading within the narrower range implies that neither buyers nor sellers have the upper hand. However, this stalemate could be resolved if investors heed the bullish call from the Moving Average Convergence Divergence (MACD) indicator and start booking their positions in Cardano ahead of the upcoming sell-off.
A buy signal manifests from the momentum indicator as the blue MACD line crosses above the signal line. However, this is not enough, the indicator must be moving in an upward direction toward the mean line (0.00) and into the positive region.
Traders may not want to actively trade Cardano at the moment, especially with the choppy market continuing. However, a break above the 50-day Exponential Moving Average (EMA) at $0.2584 and subsequently the narrow range limit could offer a few profitable opportunities within the wider range.
It is worth mentioning that new buy orders may begin to go live above the 50-day EMA, with a stop loss at the range support at $0.25 or, slightly lower. On the upside, such a breakout would be accompanied by increased volume. Profit booking might start at the 100-day EMA (blue) but some may want to hold on until ADA price hits the upper range limit of $0.275.
The Relative Strength Index (RSI) on the daily chart, has recovered to 40 following a trip to the oversold region. Despite the weak market structure bulls still influence Cardano.
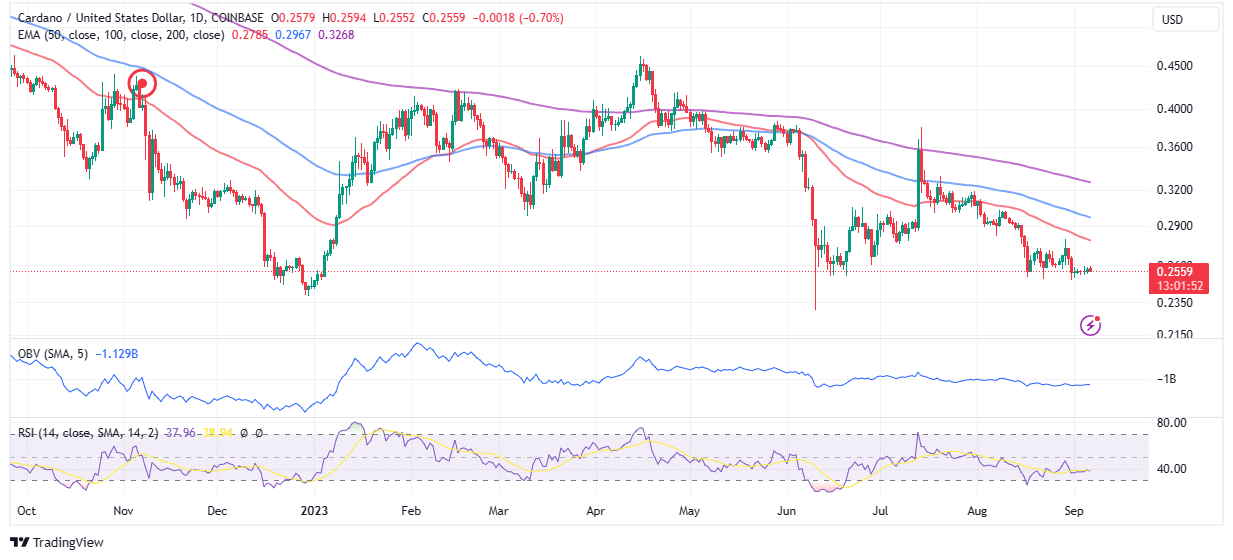
For ADA to sustain an uptrend, investors must be willing to put money in the token, which will build momentum. For now, the On-Balance Volume indicator shows that the inflow of funds equals the outflow volume, thus canceling out and leaving ADA price without enough liquidity.
Related Articles

Why Trust CoinGape
CoinGape has covered the cryptocurrency industry since 2017, aiming to provide informative insights Read more… to our readers. Our journal analysts bring years of experience in market analysis and blockchain technology to ensure factual accuracy and balanced reporting. By following our Editorial Policy, our writers verify every source, fact-check each story, rely on reputable sources, and attribute quotes and media correctly. We also follow a rigorous Review Methodology when evaluating exchanges and tools. From emerging blockchain projects and coin launches to industry events and technical developments, we cover all facets of the digital asset space with unwavering commitment to timely, relevant information.

Delivered every day.
- Insights that move markets
- 100,000 active subscribers