Avalanche Price Analysis: AVAX Coin Bounces From 50% Retracement Level; Right Time To Buy?


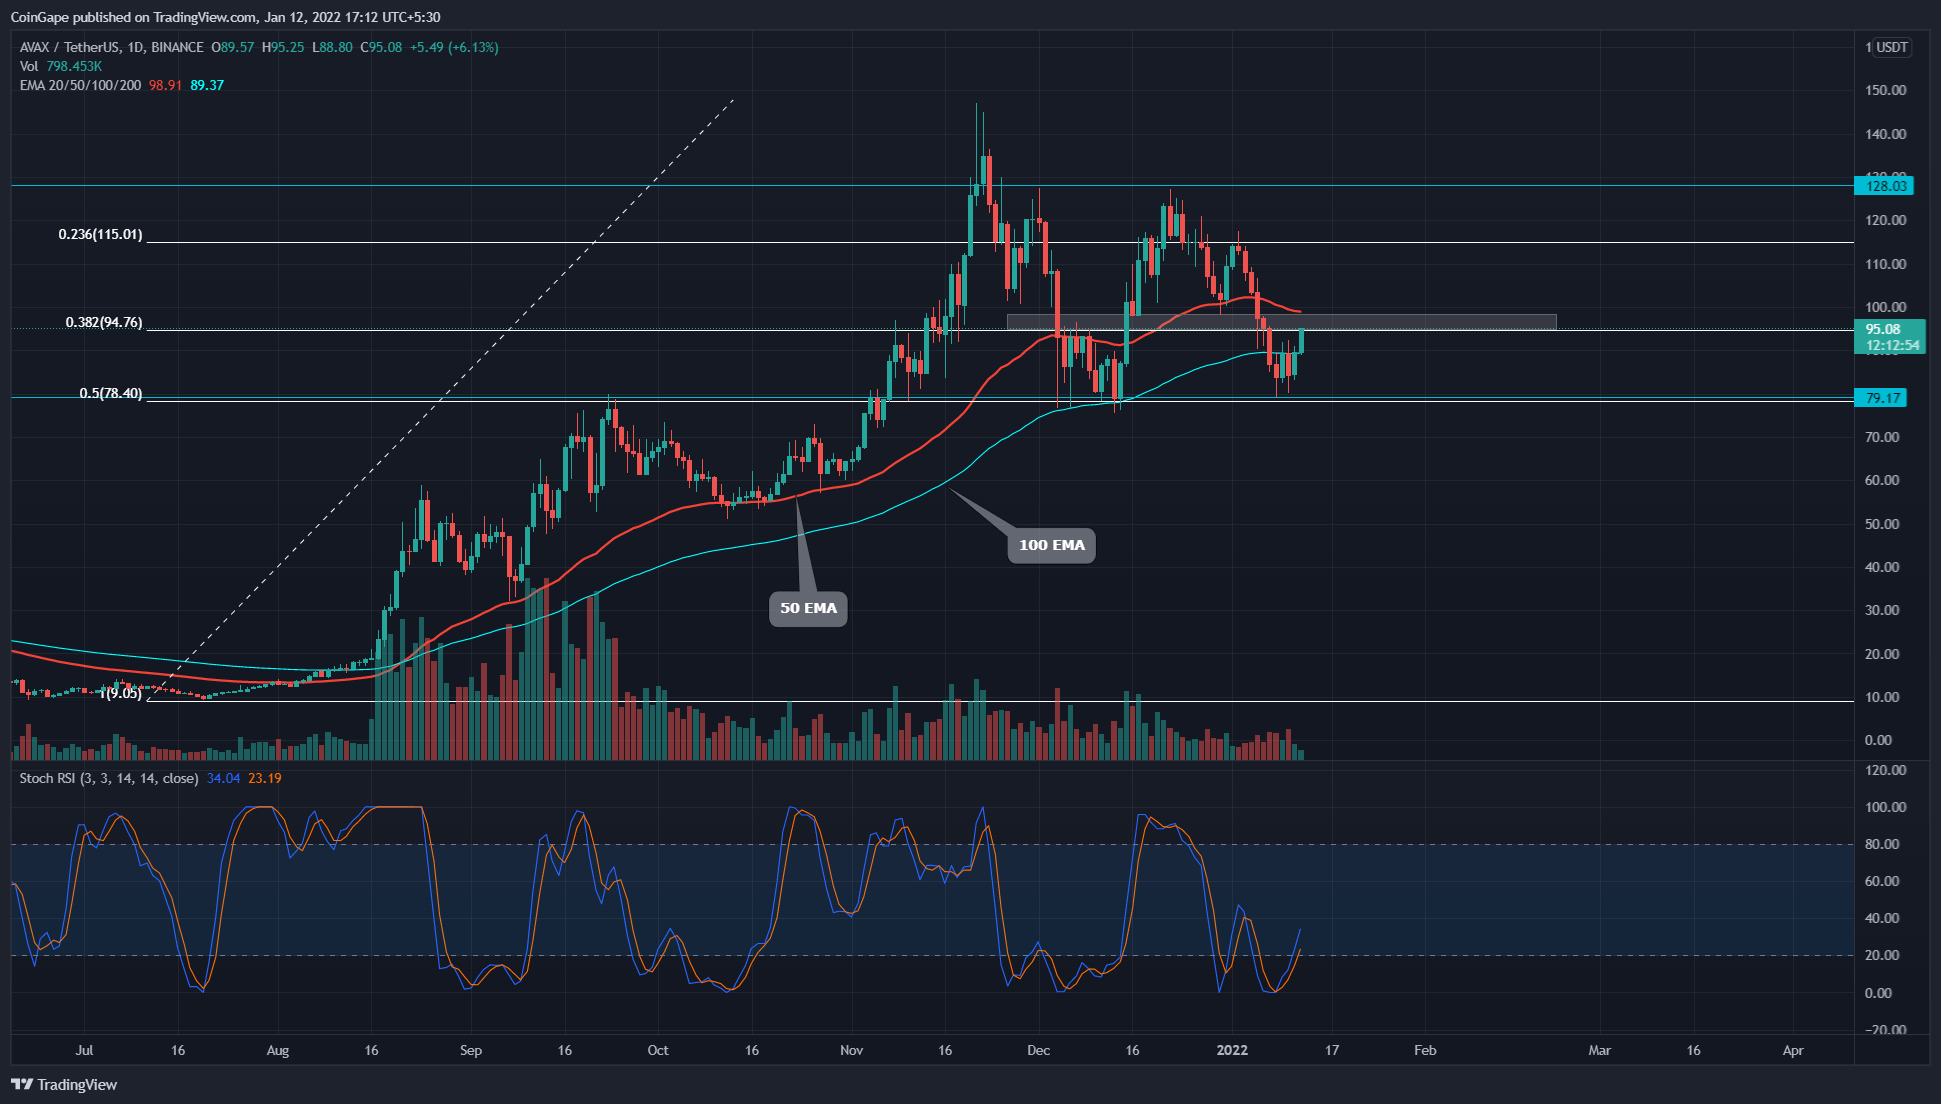
The Avalanche (AVAX) coin faced a constant bear attack right from the start of 2022. The coin lost nearly 37% from the previous swing high of $128 and dropped to the 0.5 FIB support(79.2). The technical chart shows reversal signs from this support, hoping for a recovery rally.
Key technical points:
- The AVAX coin bulls reclaim the 100-day EMA
- The daily-Stochastic RSI provides a bullish crossover of the K and D line
- The intraday trading volume in the AVAX coin is $858.8 Million, indicating a 19.2% loss
 Source- Tradingview
The last time when we covered an article on Avalanche coin, this pair indicated an impressive recovery rally, aiming for the All-TIme High resistance of $147. However, the price faced intense supply from an in-between resistance of $128, resulting in a bearish crossover.
Thus, the price started to drop again and plunged back to the 0.5 Fibonacci retracement level. The coin price spent a few days trying to identify enough demand pressure from this support before presenting this slight hint for reversal.
The recent bloodbath in the crypto market had engulfed the crucial EMA levels(20, 50, and 100). The price is still trading above the 200 EMA, presenting an overall bullish outlook for this coin.
The Daily-Stochastic RSI shows the K and D lines offer bullish crossovers, providing more confirmation for a bullish reversal.
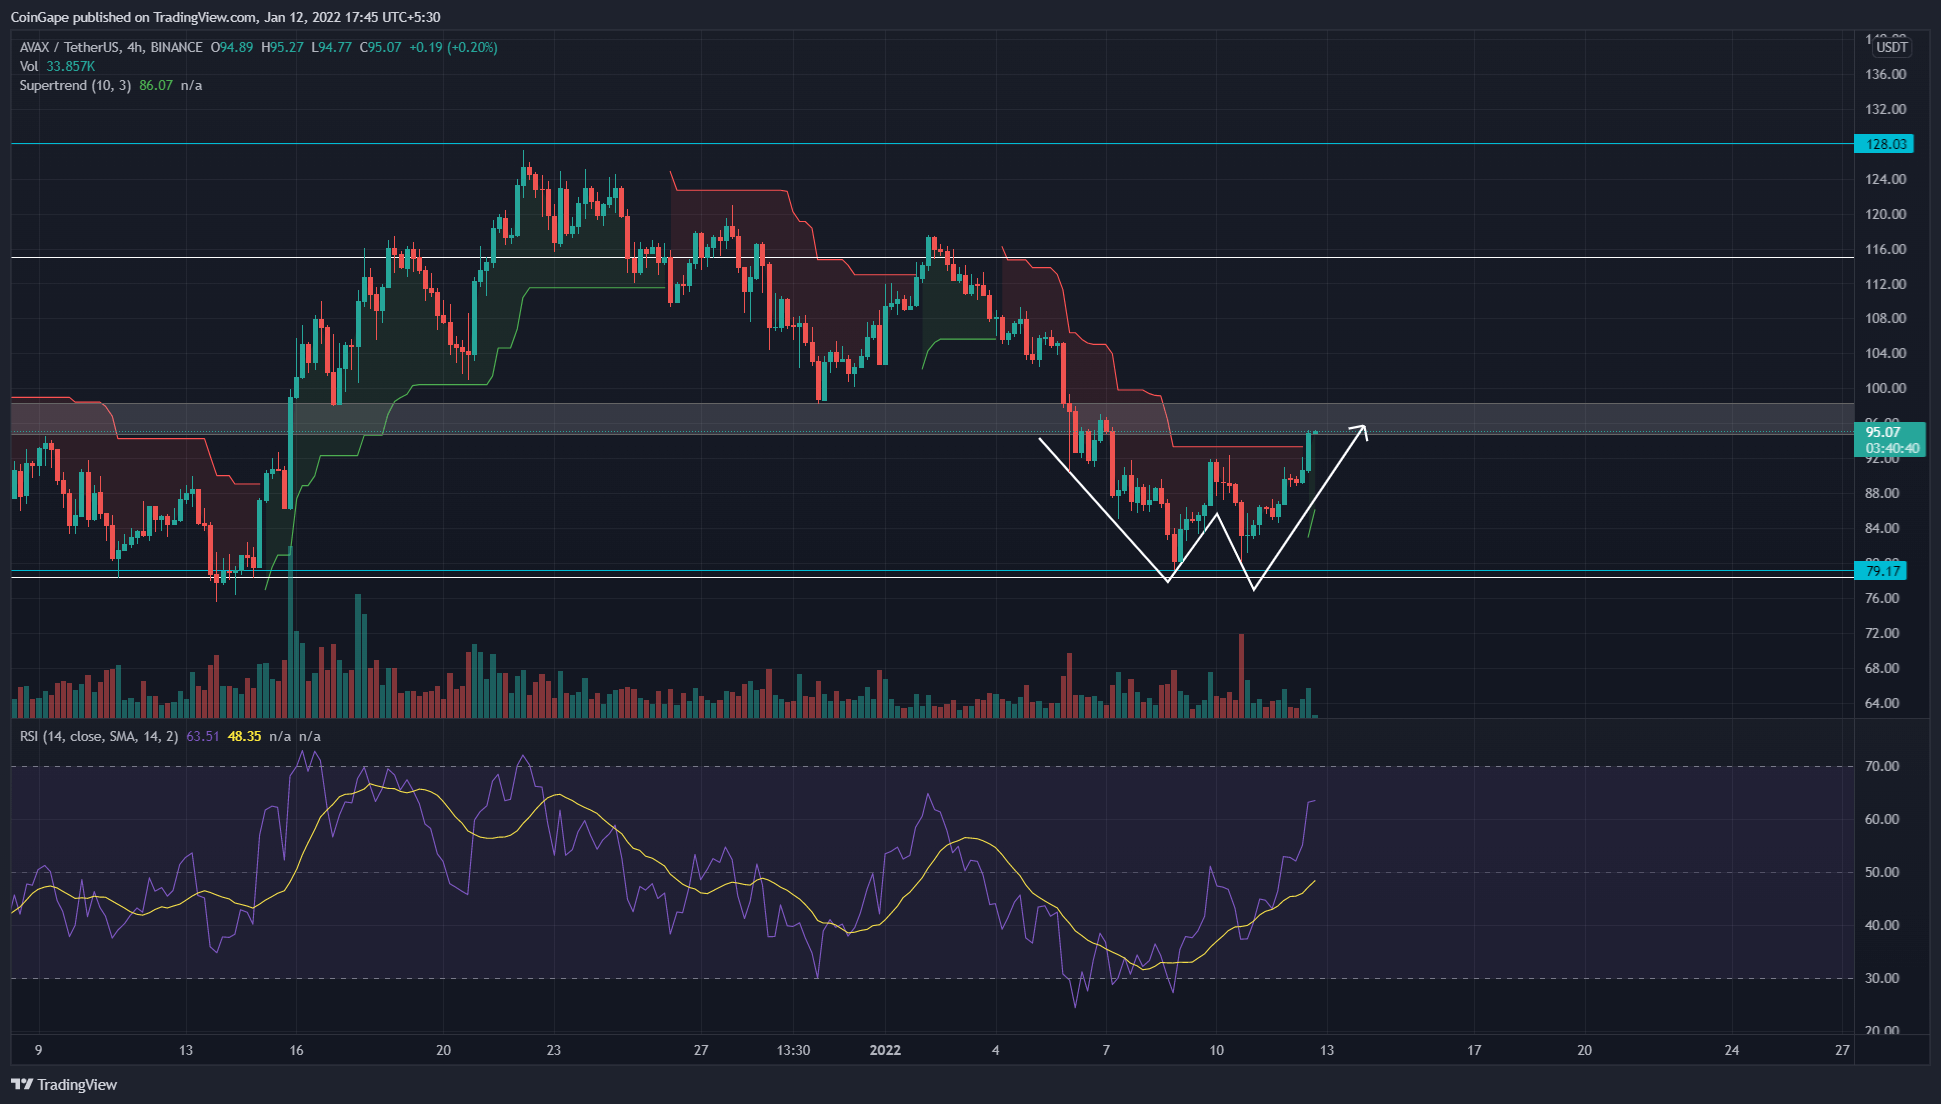
AVAX Price Shows A Double Bottom Pattern In The 4-hour Time Frame Chart
 Source- Tradingview
The AVAX coin forms a double bottom pattern from the base of $79.2. The coin price is quite close to the resistance neckline of $98.2. Once the price shows a decisive breakout and sustainability above this level, the crypto traders can look for a long opportunity.
The Relative Strength Index(63) shows a striking pump compared to the price action, indicating the increasing underlying bullishness of the coin.
The Supertrend indicator turns greens as the price shows a steady rally in this lower time frame chart.
- Resistance levels- $98.2, and $117
- Support levels-$86 and $79.2

Why Trust CoinGape
CoinGape has covered the cryptocurrency industry since 2017, aiming to provide informative insights Read more… to our readers. Our journal analysts bring years of experience in market analysis and blockchain technology to ensure factual accuracy and balanced reporting. By following our Editorial Policy, our writers verify every source, fact-check each story, rely on reputable sources, and attribute quotes and media correctly. We also follow a rigorous Review Methodology when evaluating exchanges and tools. From emerging blockchain projects and coin launches to industry events and technical developments, we cover all facets of the digital asset space with unwavering commitment to timely, relevant information.

Delivered every day.
- Insights that move markets
- 100,000 active subscribers
Related Articles


- XRP Tops BTC, ETH in Institutional Flows As Standard Chartered Lowers 2026 Forecasts
- Bitcoin vs. Gold: Expert Predicts BTC’s Underperformance as Options Traders Price in $20K Gold Target
- CLARITY Act: White House to Hold Another Meeting as Crypto and Banks Stall on Stablecoin Yield Deal
- Bitcoin as ‘Neutral Global Collateral’? Expert Reveals How BTC Price Could Reach $50M
- XRP Ledger Validator Spotlights Upcoming Privacy Upgrade as Binance’s CZ Pushes for Crypto Privacy
- Dogecoin, Shiba Inu, Pepe Coin Price Predictions As BTC Crashes Below $68k
- Ethereum Price Outlook as Harvard Shifts Focus from Bitcoin to ETH ETF
- HOOD and COIN Stock Price Forecast as Expert Predicts Bitcoin Price Crash to $10k
- XRP Price Prediction Ahead of Supreme Court Trump Tariff Ruling
- Crypto Price Prediction For This Week: Dogecoin, Solana and Cardano
- Bitcoin Price Prediction: How Could Brazil’s Strategic Bitcoin Reserve Proposal Impact BTC?


