 Buy $GGs
Binance Coin In The Green While Ethereum Falls On Its Chart: Crucial Price Levels


Bitcoin dipped on its chart and soon the altcoin industry observed similar movements across their price charts. At the time of writing Bitcoin was priced below $50k. Ethereum also dipped by almost 4% in the past 24 hours and was available for $3901.
Binance Coin, however, was among the top few prominent coins that were still seen trading in the green. For Ethereum to be back on track, the alt would need to be back above the $4010.80 line as the aforementioned price level was previously acting as a robust support level.
Binance Coin after a tiny dip yesterday was back on its feet as the coin was trading far up away from its immediate support line of $528.5.
Ethereum/USD Four-Hour Chart
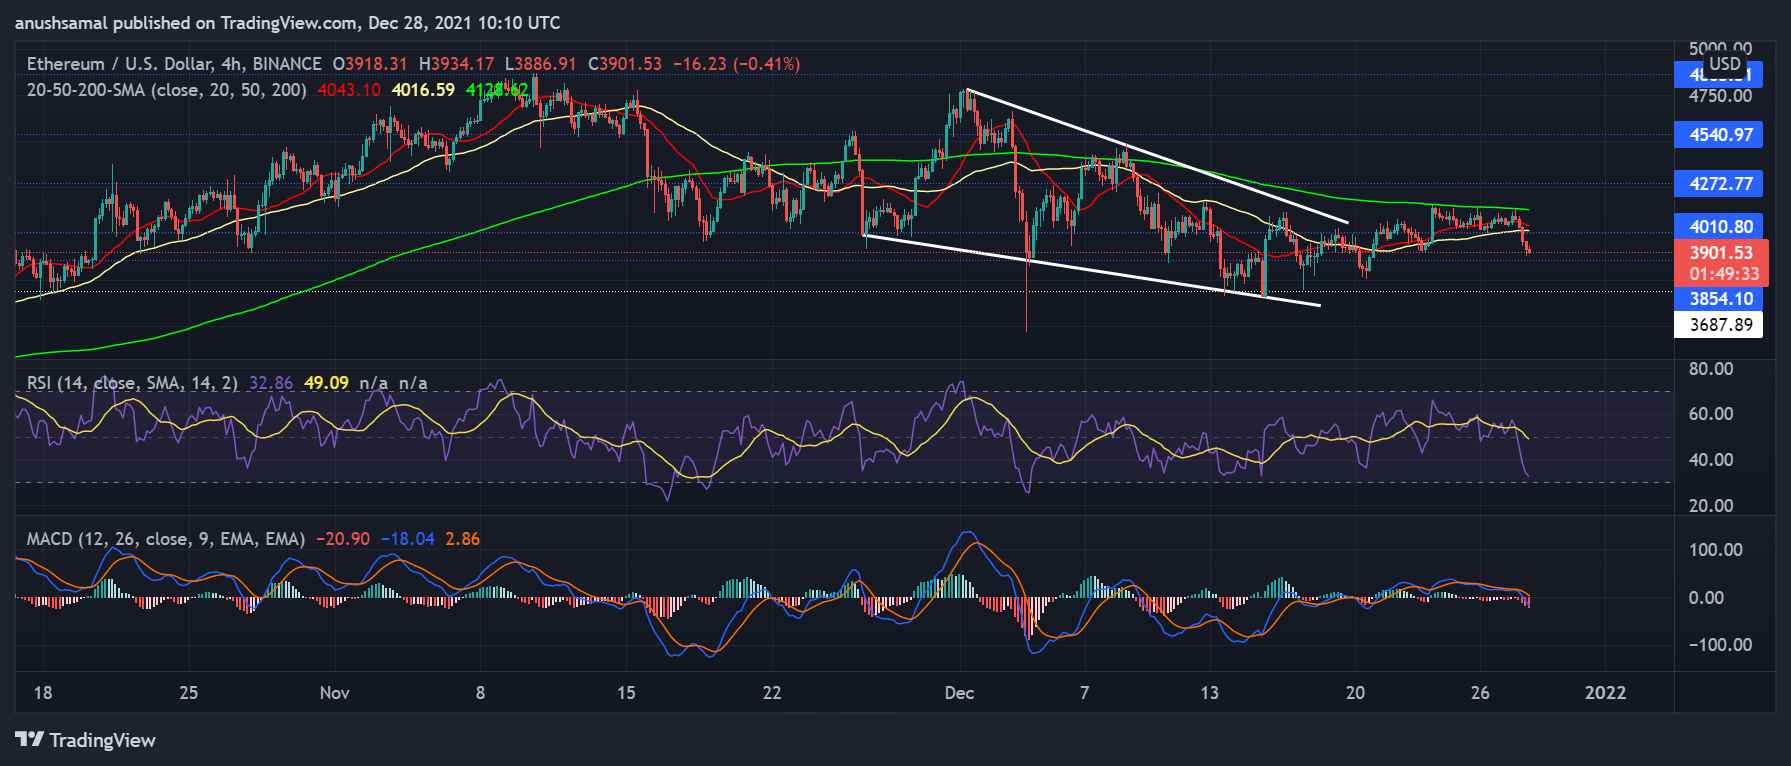
Ethereum has formed a descending wedge, post which the coin had shortly embarked on an upward journey. At press time, however, Ethereum just broke below the $4010.80 price floor and was priced at $3901.53 at the time of writing.
Falling beneath this level would cause ETH to trade near the $3854.10 mark. In the past few weeks, Ethereum’s prices steeled above the $4010.80 support mark, hence, for ETH to invalidate this bearish thesis it would need to trade above the aforementioned level.
The Relative Strength Index also noted a steep fall as buyers left the market, the indicator was standing close to the oversold region. MACD underwent a bearish crossover and displayed red histograms. On the four hour chart, Ethereum was below the 20-SMA line indicating that selling pressure dominated the market.
BNB/USD Four-Hour Chart
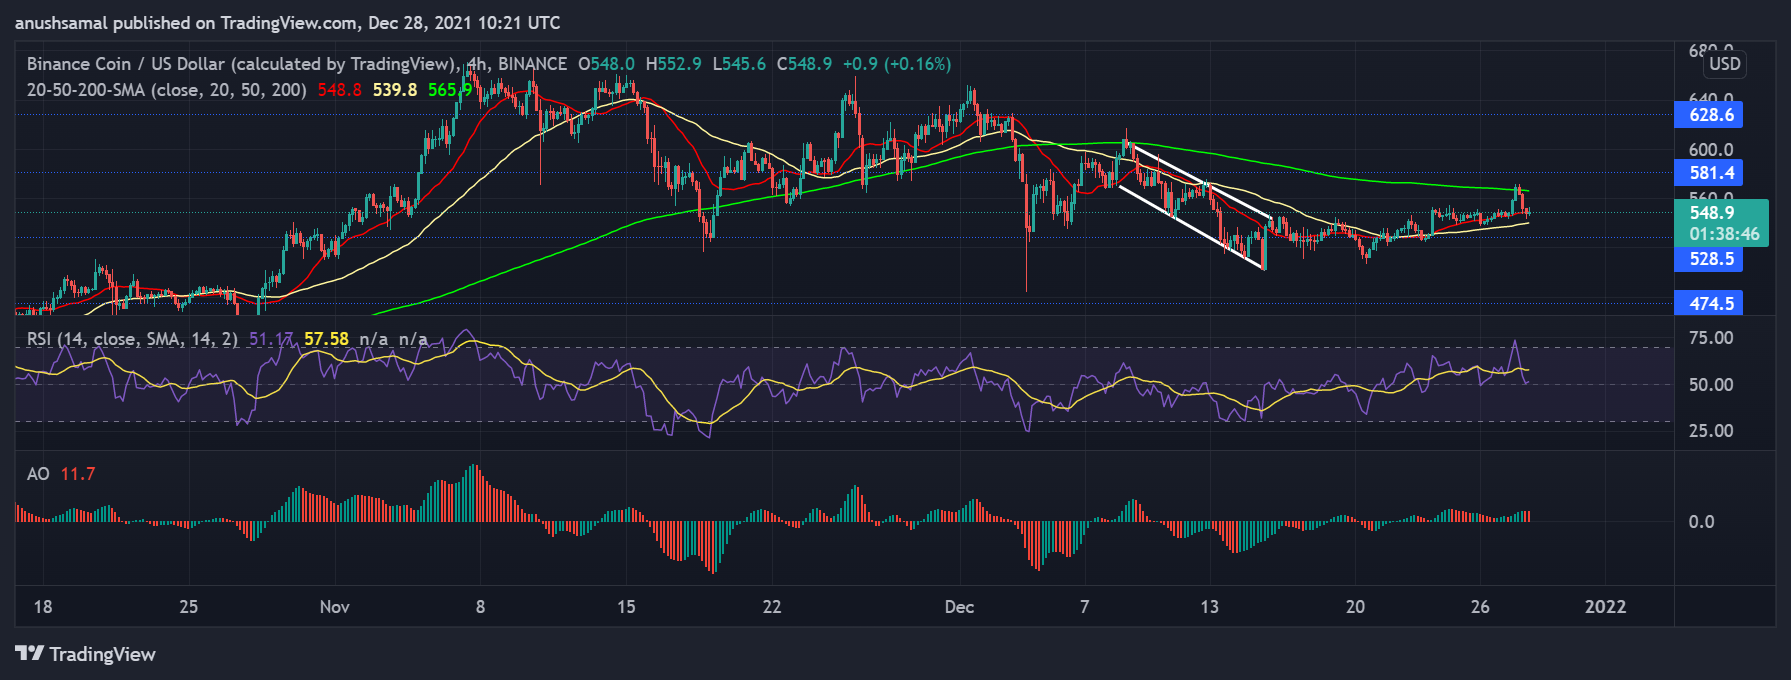
Binance Coin was one of the coins that reflected positive sentiments across the industry. Over the past 24 hours, Binance Coin remained above its immediate support line. The coin was exchanging hands at $548.9 at the time of writing.
Binance Coin has consistently moved on an uptrend and its immediate resistance mark stood at $581.4. Even though BNB was below 200-SMA, the coin regained momentum and moved to trade above the 20-SMA, a reading that states selling pressure were lesser than buying strength.
The Relative Strength Index was at the half-line, although it fell from the overbought one by a couple of points, the indicator was still bullish at the time of writing. Awesome Oscillator was displaying red signal bars which were indicative that prices might again fall over the upcoming trading sessions.
Play 10,000+ Casino Games at BC Game with Ease
- Instant Deposits And Withdrawals
- Crypto Casino And Sports Betting
- Exclusive Bonuses And Rewards


Why Trust CoinGape
CoinGape has covered the cryptocurrency industry since 2017, aiming to provide informative insights Read more… to our readers. Our journal analysts bring years of experience in market analysis and blockchain technology to ensure factual accuracy and balanced reporting. By following our Editorial Policy, our writers verify every source, fact-check each story, rely on reputable sources, and attribute quotes and media correctly. We also follow a rigorous Review Methodology when evaluating exchanges and tools. From emerging blockchain projects and coin launches to industry events and technical developments, we cover all facets of the digital asset space with unwavering commitment to timely, relevant information.

Delivered every day.
- Insights that move markets
- 100,000 active subscribers
Related Articles


- Peter Brandt Flips Bullish, Predicts Bitcoin Rally As Price Holds Above $70k
- XRP News: Institutional Use Case Expands as Doppler Finance Integrates WXRP for Multi-Chain Access
- Trump Tariffs: Bitcoin Faces Fresh Headwinds as 15% Global Tariffs Begin This Week Amid Iran War
- Bitget Unveils ‘Crypto Anti-Bias Pledge’ To Support Women’s Inclusion In Crypto
- U.S.-Iran War: Crypto Market Rebounds as Iran Reportedly Reaches Out To U.S. To End Conflict
- Dogecoin Price Outlook as BTC Recovers Above $73,000
- XRP Price Prediction as Iran-U.S. Peace Talks Trigger a Crypto Rally
- COIN Stock Analysis as Bitcoin Retests $72k Ahead of February NFP Data
- Robinhood Stock Price Prediction As Cathie Wood Buys $12M Dip in Bold ARK Move
- Bitcoin Price At Risk? Professor Who Predicted US-Iran War Says America Could Lose
- Gold Price Prediction March 2026: Rally, Crash, or Record Highs?


