 Buy $GGs
Binance Coin Price Prediction: BNB Could Make A 26% Upswing To $648


More than $2 billion in daily trading volume makes the Binance Coin (BNB) one of the top cryptos to watch in 2022. However, the current threat is the sustained confinement within the descending parallel channel as some analysts fear that the Binance Coin price might plunge even further.
Still, BNB bulls remain hopeful that Binance can escape from the bearish chart pattern that might take the BNP price towards $1,000 by the end of 2022.
Binance Coin Price Prepares For A 26% Bullish Rally
At the time of writing, the BNB price hovers in the green around $513.1 as bulls fight to hold on to the $503 support embraced by the middle boundary of the descending channel.
Binance Coin price correction has continued since the token of the largest crypto exchange network lost as much as 12% to fall below the $600 mark on November 26. There have been several attempts at recovery but the BNB/USD price has continuously been rejected by resistance from the upper boundary of the prevailing chart pattern.
Note that as long as Binance remains within the confines of the descending parallel channel, its price is set to go lower.
Therefore, a closure below the immediate resistance at $503 could see the BNB price fall to tag the lower boundary of the channel.
BNB/USD Daily Chart
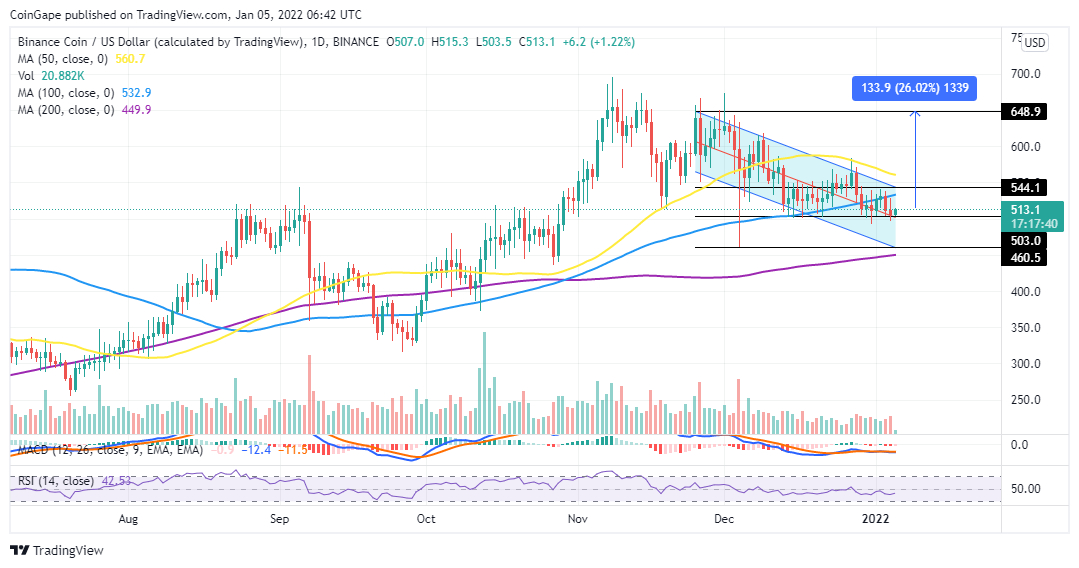
The decreasing volume and the position of the Moving Average Convergence Divergence (MACD) indicator below the zero line in the negative region accentuate Binance’s bearish thesis. Note that the MACD has sent a call to sell BNB signal on the same daily chart. This happened on January 03 when the 12-day exponential moving average (EMA) crossed below the 26-day EMA adding momentum to the price correction.
However, should Binance Coin turn away from the price correction it could rise to tag the -day Simple Movign Average (SMA) at $532. A clear bullish breakout will be achieved if bulls push the price beyond this level to overcome the $544 resistance embraced by the upper boundary of the prevailing chart pattern.
Beyond this point, BNB could launch a bullish rally tagging the target of the top of the descending channel at $648. This is approximately 26% upswing from the current price.
The appearance of a bullish candlestick and the upward movement of the Relative Strength Index (RSI) away from the oversold region as shown on the daily chart accentuates this bullish outlook.
Play 10,000+ Casino Games at BC Game with Ease
- Instant Deposits And Withdrawals
- Crypto Casino And Sports Betting
- Exclusive Bonuses And Rewards


Why Trust CoinGape
CoinGape has covered the cryptocurrency industry since 2017, aiming to provide informative insights Read more… to our readers. Our journal analysts bring years of experience in market analysis and blockchain technology to ensure factual accuracy and balanced reporting. By following our Editorial Policy, our writers verify every source, fact-check each story, rely on reputable sources, and attribute quotes and media correctly. We also follow a rigorous Review Methodology when evaluating exchanges and tools. From emerging blockchain projects and coin launches to industry events and technical developments, we cover all facets of the digital asset space with unwavering commitment to timely, relevant information.

Delivered every day.
- Insights that move markets
- 100,000 active subscribers
Related Articles


- Indiana Signs Bitcoin Bill Into Law Allowing Crypto in Retirement Plans
- ‘Time to Act Is Now’: CFTC Chief Pushes Swift Passage of CLARITY Act
- Trump Tells Congress to Pass Crypto Market Bill ‘ASAP,’ Blasts Banks for Stalling
- BTC Price Bounces as Spot Investors Buy The Dip Amid Iran War Jitters
- CFTC Chief Mike Selig Signals US Crypto Perpetual Futures Rollout in Coming Weeks
- Gold Price Prediction March 2026: Rally, Crash, or Record Highs?
- RIOT Stock Prediction as Needham, Piper Sandler Slash Target After Earnings
- Cardano Price Outlook As Charles Hoskinson Warns Over CLARITY Act
- Circle Stock Price Climbs 15% to $96, Can Rally Continue in March 2026?
- Bitcoin Price Prediction as US-Iran War Enters 4th Consecutive Day
- Top 5 Historical Reasons Dogecoin Price Is Not Rising


