 Buy $GGs
Bitcoin, Polkadot Price Analysis: September 21, 2021


- Bitcoin holds in the demand zone above $40,000, but recovery is still limited to under $43,000.
- Polkadot retests support at $25 following a failed attempt at breaking $40 resistance last week.
The cryptocurrency market appears to be purging off weak hands as declines keep on ravaging through the market. Currently, the total market share stands at $1.9 trillion, down from a seven-day high of $2.2 trillion, recorded on September 16.
The Chinese property giant, Evagrande woes likely extended to the crypto market after tipping the stock market off-balance earlier this week. Over the last few days, Bitcoin inflows on Binance soared as a sign of increased selling pressure from China.
Meanwhile, the market is mainly in red, with Ethereum falling to $2,650 for the first time since the first week of August. As discussed, the smart contracts token will likely dance between $2,400 and $3,200 in the coming session or days before it takes the next course of action.
Bitcoin:-
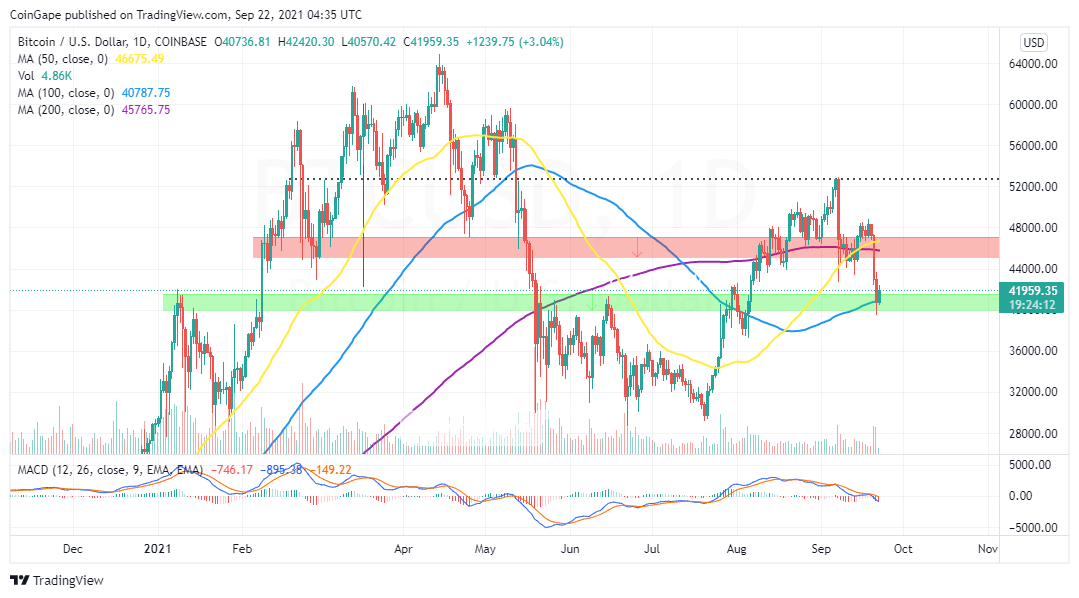
Bitcoin could not hold above $48,000 during the run-up last week, which led to an initial correction that later developed into a massive selloff. The pulldown on the largest cryptocurrency has not slowed down over the previous three days.
Trading below the red zone made the bearish situation worse, with Bitcoin forced to seek refuge at $40,000. The green zone currently holds Bitcoin in place, thwarting the prevalent bearish pressure from exploring areas under $40,000.
The flagship cryptocurrency is trading around $42,000 amid a recovery push by the bulls. Although the 100-day Simple Moving Average (SMA) adds weight to the support zone, upward movement is limited below $43,000.
Many analysts believe it is vital to be cautiously bullish on Bitcoin, perhaps until it confirms a break above $45,000 and $46,000. In the meantime, a bearish may continue to above BTC while the potential for losses below $40,000 grows.
BTC/USD Daily Chart
Polkadot:-
Polkadot is back to trading below $30 for the first time in two weeks. This smart contracts token had closed in on $40 by early last week, but overhead pressure overwhelmed the bulls. Meanwhile, expected support at the ascending trendline did little to keep the bearish impact at bay.
Subsequently, losing support at $30 further destabilized DOT, resulting in another dip to $25. Although trading at $27 at the time of writing, recovery would be a challenging endeavor. Resistance is anticipated at the 50-day SMA and the 200-day SMA in addition to the seller congestion at $30.
DOT/USD Daily Chart
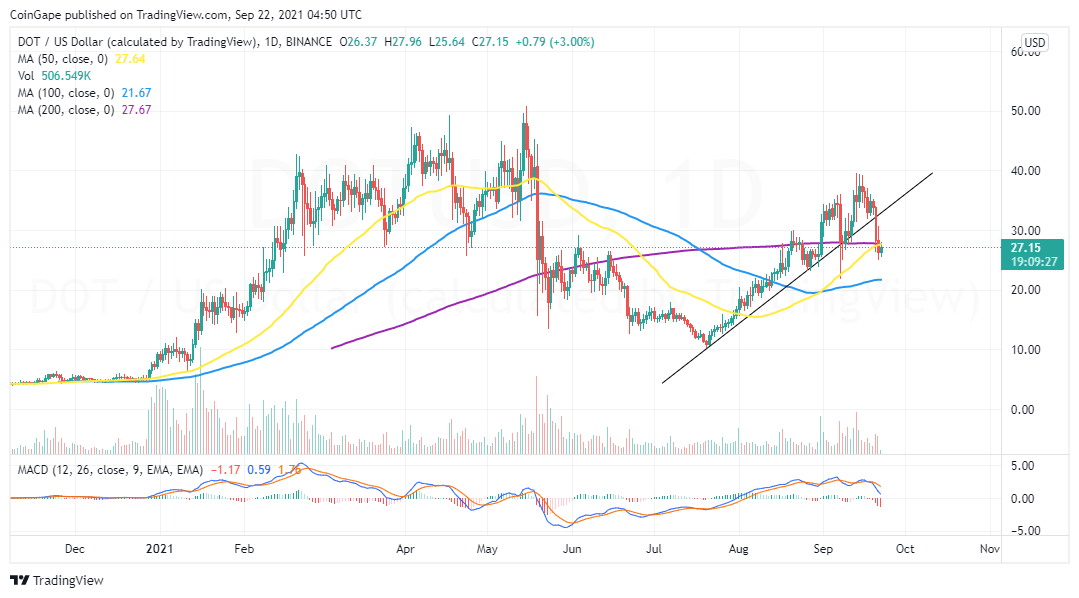
Realize that The MACD has a vivid bearish picture, implying that the pressure on top of Polkadot is nevertheless apparent. Therefore, it is essential to remain bullishly cautious in the coming few sessions. A confirmed break above the 50-day SMA might validate an uptrend past $30.
Play 10,000+ Casino Games at BC Game with Ease
- Instant Deposits And Withdrawals
- Crypto Casino And Sports Betting
- Exclusive Bonuses And Rewards


Why Trust CoinGape
CoinGape has covered the cryptocurrency industry since 2017, aiming to provide informative insights Read more… to our readers. Our journal analysts bring years of experience in market analysis and blockchain technology to ensure factual accuracy and balanced reporting. By following our Editorial Policy, our writers verify every source, fact-check each story, rely on reputable sources, and attribute quotes and media correctly. We also follow a rigorous Review Methodology when evaluating exchanges and tools. From emerging blockchain projects and coin launches to industry events and technical developments, we cover all facets of the digital asset space with unwavering commitment to timely, relevant information.

Delivered every day.
- Insights that move markets
- 100,000 active subscribers
Related Articles


- Trump Tariffs: Bitcoin Faces Fresh Headwinds as 15% Global Tariffs Begin This Week Amid Iran War
- Bitget Unveils ‘Crypto Anti-Bias Pledge’ To Support Women’s Inclusion In Crypto
- U.S.-Iran War: Crypto Market Rebounds as Iran Reportedly Reaches Out To U.S. To End Conflict
- Bitget Rolls Out Group-Based Maker Rates to Boost Liquidity Across Spot and Futures
- Kraken Gains Access To The Federal Reserve’s Payment System as Ripple Awaits Approval
- COIN Stock Analysis as Bitcoin Retests $72k Ahead of February NFP Data
- Robinhood Stock Price Prediction As Cathie Wood Buys $12M Dip in Bold ARK Move
- Bitcoin Price At Risk? Professor Who Predicted US-Iran War Says America Could Lose
- Gold Price Prediction March 2026: Rally, Crash, or Record Highs?
- RIOT Stock Prediction as Needham, Piper Sandler Slash Target After Earnings
- Cardano Price Outlook As Charles Hoskinson Warns Over CLARITY Act


