 Buy $GGs
Bitcoin Price Analysis: BTC Stable Above $40,000 As Consolidation Takes Precedence


- Bitcoin price holds firmly to the demand zone above $40,000 and is reinforced by the 100-day SMA.
- The IOMAP on-chain model highlights immense resistance and support levels, hinting at BTC’s consolidation lasting longer.
The flagship cryptocurrency appears to be in stasis between a rock and a hard place. On the downside, $40,000 has grown to be formidable support, while on the upside, $44,000 is a significant hindrance to the uptrend.
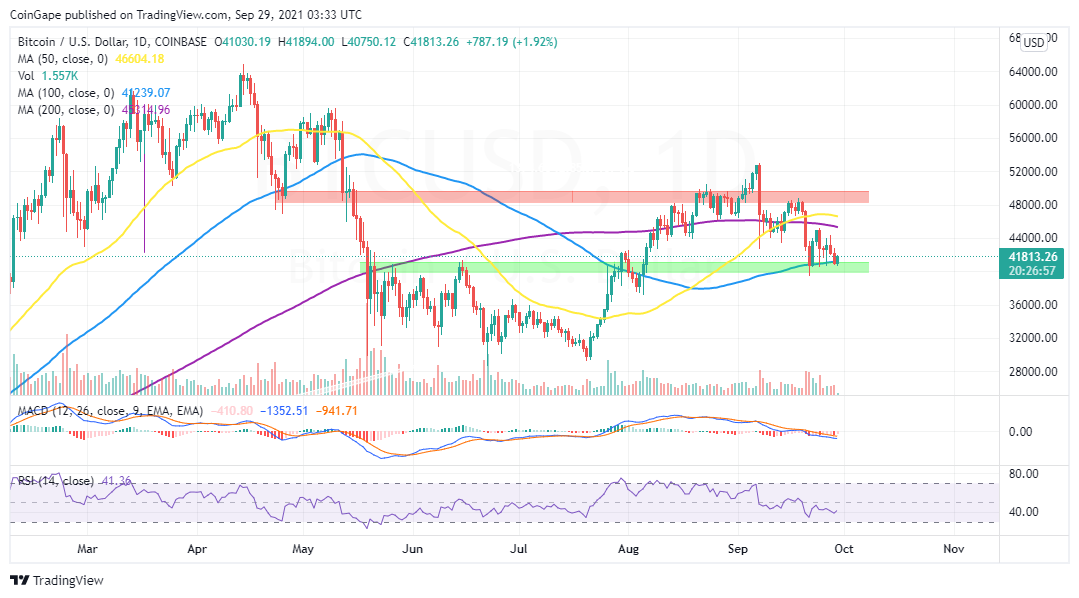
At writing, Bitcoin trades slightly above $40,000, and bulls seem to have the upper hand. The 100-day Simple Moving Average (SMA) fortifies the demand zone in green while the 200-day SMA adds weight to the resistance, marginally above $44,000.
Bitcoin Price Consolidation Could Last Longer
Many analysts believe that Bitcoin is at a crucial junction and that bulls will likely emerge winners in the ongoing brawl. However, it is essential to anticipate a more extended sideways trading period based on the overall technical picture.
As established, Bitcoin is free to move between $40,000 and $44,000 in the meantime, but action to the supply zone in red would not be an easy task. The Moving Average Convergence Divergence (MACD) slightly inclined to the bearish side, notwithstanding the leveling motion.
On the other hand, the Relative Strength Index (RSI) holds 40 as the immediate support and points upward. This infers that buyers have a firmer grip and could eventually push the price. Hence, the tug of war between the bulls and bears will likely continue in the coming sessions until we get a formidable break, either above $44,000 or below $40,000.
BTC/USD Daily Chart
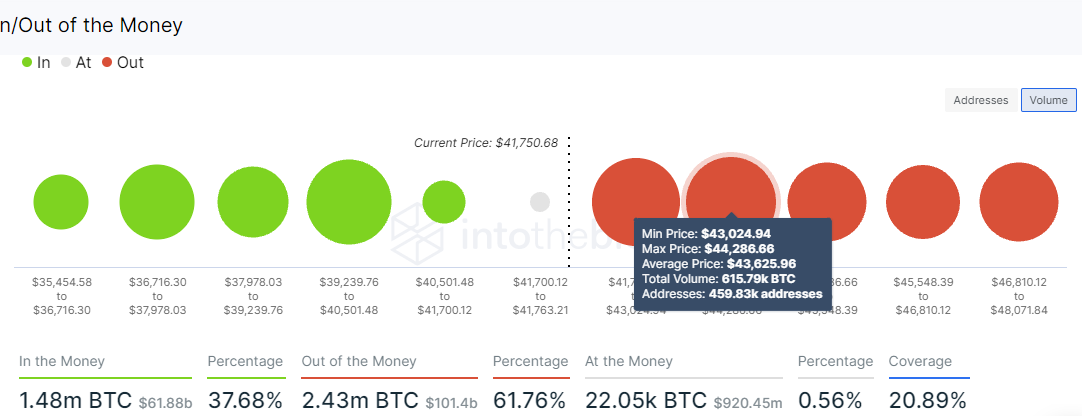
The picture of Bitcoin in stasis is also reflected from an on-chain point of view. According to IntoTheBlock’s IOMAP, Bitcoin has few open spaces to explore. Immediate on the upside, the bellwether cryptocurrency is coming to terms with the immense barrier, running from $41,763 to $43,025. Here roughly 901,600 addresses bought approximately 574,800 BTC. This zone is succeeded by several other relatively strong resistance such as $43,625 and $44,995.
On the flip side, Bitcoin sits on top of a robust demand zone, spanning from $39,240 to $40,504. Here, around 544,000 addresses purchased nearly 520,000 BTC. As long as the support and the resistance remain intact, Bitcoin will stick to consolidation a while longer.
Bitcoin IOMAP Chart
Bitcoin Intraday Levels
Spot rate: $42,000
Trend: Bullish bias
Volatility: Low
Support: $40,000
Resistance: $44,000
Play 10,000+ Casino Games at BC Game with Ease
- Instant Deposits And Withdrawals
- Crypto Casino And Sports Betting
- Exclusive Bonuses And Rewards


Why Trust CoinGape
CoinGape has covered the cryptocurrency industry since 2017, aiming to provide informative insights Read more… to our readers. Our journal analysts bring years of experience in market analysis and blockchain technology to ensure factual accuracy and balanced reporting. By following our Editorial Policy, our writers verify every source, fact-check each story, rely on reputable sources, and attribute quotes and media correctly. We also follow a rigorous Review Methodology when evaluating exchanges and tools. From emerging blockchain projects and coin launches to industry events and technical developments, we cover all facets of the digital asset space with unwavering commitment to timely, relevant information.

Delivered every day.
- Insights that move markets
- 100,000 active subscribers
Related Articles


- Is Bitcoin Dead? Here’s What the Data Really Says
- US-Iran War: Meme Coin Market Plunges After Iranian Drone Hits US Embassy in Kuwait
- Arthur Hayes Sees 5x HYPE Token Rally as Oil Perps Pump on Hyperliquid Amid U.S.–Iran War
- How BTC, ETH and XRP Prices React as Crude Oil and Safe Havens Surge After Khamenei’s Death
- BREAKING: Iran Refutes WSJ’s Claims on Push to Resume Nuclear Talks with US, Bitcoin Slips
- Bitcoin And XRP Price As US Kills Iran Supreme Leader- Is A Crypto Crash Ahead?
- Gold Price Prediction 2026: Analysts Expect Gold to Reach $6,300 This Year
- Circle (CRCL) Stock Price Prediction as Today is the CLARITY Act Deadline
- Analysts Predict Where XRP Price Could Close This Week – March 2026
- Top Analyst Predicts Pi Network Price Bottom, Flags Key Catalysts
- Will Ethereum Price Hold $1,900 Level After Five Weeks of $563M ETF Selling?


