 Buy $GGs
Bitcoin Price Analysis: BTC Triangle Breakout Tops $11,500


- Bitcoin appears to have bottomed out, giving way for gains towards $12,000.
- The on-chain analysis shows the absence of tough resistance heading to $12,000.
The flagship cryptocurrency eventually broke out above the stubborn resistance at $11,000. The impressive weekend gains extended to $11,500. However, the tremendous bullish pressure appears to have taken a pit stop in the range between $11,200 and $11,500. Meanwhile, BTC/USD is teetering at $11,360 as bulls take a hiatus before resuming the final approach to highs $12,000.
The symmetrical triangle pattern explored on Friday gave the bulls the boost the needed. This triangle pattern illustrates consolidating prices with one trendline connecting the lower highs and another the higher highs. The trendlines tend to merge at some point, but a breakout occurs before the price hits the tip of the triangle.
BTC/USD 4-hour chart
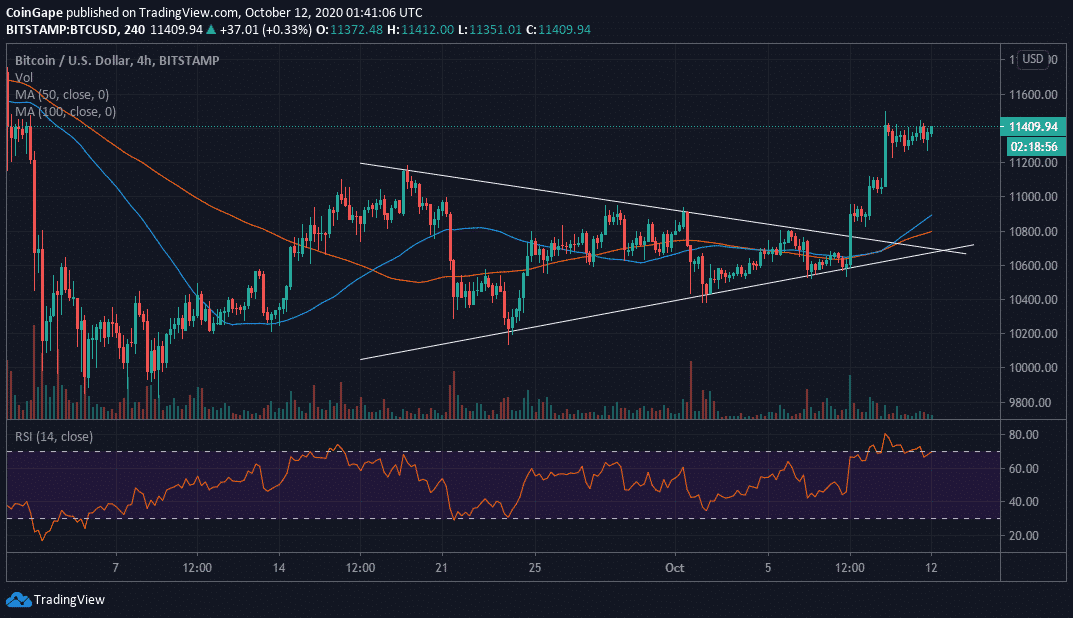
Despite bullish action stalling at $11,500, Bitcoin appears to be nurturing an uptrend according to the Relative Strength Index. Another approached at $11,500 could result in a breakout, sending Bitcoin to $12,000.
IntoTheBlock IOMAP model highlights decreasing resistance for the bellwether cryptocurrency. In other words, Bitcoin is likely to close the remaining gap towards $12,000. In the meantime, the hurdle at $11,393 – $11,722 must come out of the way. The seller congestion in this zone is brought about by the 1 million addresses that previously bought 648,000 BTC. Gains above this range pave the way for the ultimate rally beyond $12,000.
On the flip side, BTC/USD is sitting on an area with immense support. Therefore, it is doubtful that a significant reversal will take place in the near term. The primary support holds in the range between $10,370 and $10,712. Here, 1.8 million addresses previously purchased 1.2 million BTC.
Bitcoin Intraday Levels
Spot rate: $11,400
Relative change: 30
Percentage change: 0.26%
Trend: Bullish
Volatility: Low
Play 10,000+ Casino Games at BC Game with Ease
- Instant Deposits And Withdrawals
- Crypto Casino And Sports Betting
- Exclusive Bonuses And Rewards


Why Trust CoinGape
CoinGape has covered the cryptocurrency industry since 2017, aiming to provide informative insights Read more… to our readers. Our journal analysts bring years of experience in market analysis and blockchain technology to ensure factual accuracy and balanced reporting. By following our Editorial Policy, our writers verify every source, fact-check each story, rely on reputable sources, and attribute quotes and media correctly. We also follow a rigorous Review Methodology when evaluating exchanges and tools. From emerging blockchain projects and coin launches to industry events and technical developments, we cover all facets of the digital asset space with unwavering commitment to timely, relevant information.

Delivered every day.
- Insights that move markets
- 100,000 active subscribers
Related Articles


- Fed Rate Cut Odds Drop as Inflation Fears Rise Due To U.S. Iran Conflict
- Here’s Why Tether Gold (XAUt) Price Is Falling Even With Growing Gold Demand
- XRP News: Ripple Expands Payments Platform To Unify Fiat and Stablecoins Globally
- U.S.–Iran War: Bitcoin Price Extends Decline as Oil Prices Surge To Two-Year High
- Bitcoin Treasury Firm MARA Considers Selling BTC Reserves After Policy Update
- Gold Price Prediction March 2026: Rally, Crash, or Record Highs?
- RIOT Stock Prediction as Needham, Piper Sandler Slash Target After Earnings
- Cardano Price Outlook As Charles Hoskinson Warns Over CLARITY Act
- Circle Stock Price Climbs 15% to $96, Can Rally Continue in March 2026?
- Bitcoin Price Prediction as US-Iran War Enters 4th Consecutive Day
- Top 5 Historical Reasons Dogecoin Price Is Not Rising


