Bitcoin Price Prediction: BTC Could Suffer Another Rejection At $11,000


- Bitcoin breaks out of a symmetrical triangle pattern, closing in on the critical $11,000.
- BTC has a relatively clear path to $11,500 as long as buyers can pull above the short term hurdle at $11,000.
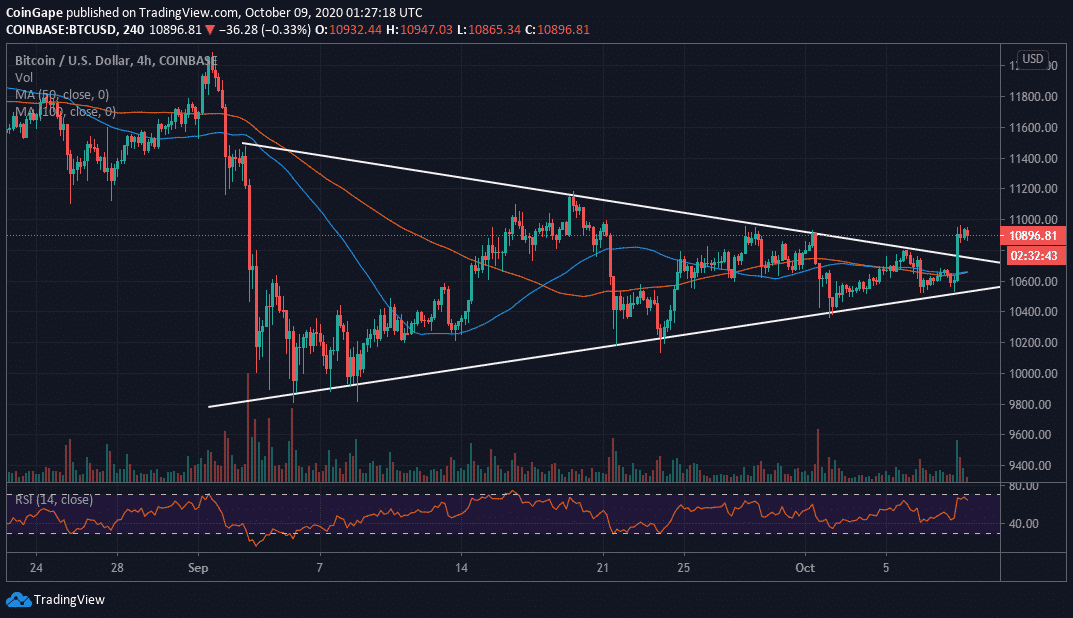
The flagship cryptocurrency broke out of a symmetrical triangle discussed multiple times this week. The 4-hour timeframe chart has seen Bitcoin print an engulfing candlestick, which culminated on a short-lived rally towards $11,000. The momentum appears to have built on the support at $10,600. Buyers cemented their position in the market by stepping above the confluence formed by the 50 Simple Moving Average and the 100 SMA.
Bitcoin exchanged hands within a whisker of $11,000 but buyers lost steam, leaving the critical level unconquered. Meanwhile, BTC is teetering at $10,900 amid a gradually building bearish grip. It is essential that the hurdle at $11,000 comes down to give bulls the ultimate push towards the psychological $12,000 level.
The Relative Strength Index (RSI) closed in on the overbought region but is pointing downwards at the momentum, illustrating the bears’ return. The volume is quite low, in a way, limiting price action. Therefore, consolidation is likely to take precedence as the weekend is ushered in. Initial support is highlighted at $10,800 but confluence formed by the 50 SMA and 100 SMA will absorb some of the selling pressure in case of a reversal. Other key levels to keep in mind include $10,600, $10,400 and the range between $10,200 and $10,000.
BTC/USD 4-hour chart
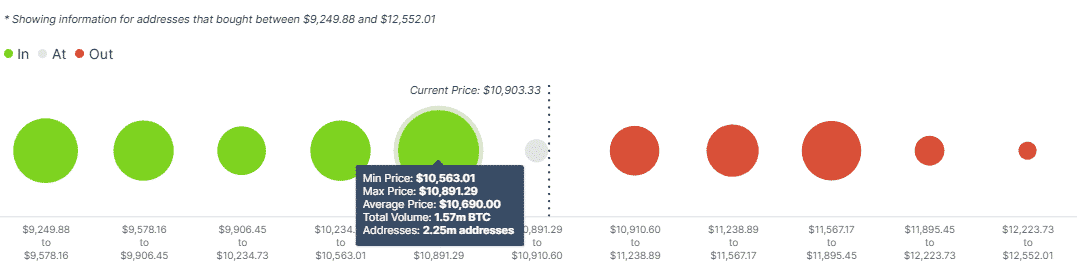
On-chain analysis using IntoTheBlock’s IOMAP model reveals reducing resistance towards the coveted $12,000 level. However, Bitcoin bulls must be ready to deal with the seller congestion between $11,567 and $11,895. Here, roughly, 960,000 addresses purchased nearly 667,000 BTC. On the downside, strong support runs from $10,563 to $10,891. Here, nearly 2.3 million addresses previously bought approximately 1.6 million BTC.
Bitcoin IOMAP chart
Bitcoin Intraday Levels
Spot rate: $10,900
Relative change: -33
Percentage change: -0.30
Trend: Short term bearish bias
Volatility: Low

Why Trust CoinGape
CoinGape has covered the cryptocurrency industry since 2017, aiming to provide informative insights Read more… to our readers. Our journal analysts bring years of experience in market analysis and blockchain technology to ensure factual accuracy and balanced reporting. By following our Editorial Policy, our writers verify every source, fact-check each story, rely on reputable sources, and attribute quotes and media correctly. We also follow a rigorous Review Methodology when evaluating exchanges and tools. From emerging blockchain projects and coin launches to industry events and technical developments, we cover all facets of the digital asset space with unwavering commitment to timely, relevant information.

Delivered every day.
- Insights that move markets
- 100,000 active subscribers
Related Articles


- Bitcoin vs Gold Feb 2026: Which Asset Could Spike Next?
- Top 3 Reasons Why Crypto Market is Down Today (Feb. 22)
- Michael Saylor Hints at Another Strategy BTC Buy as Bitcoin Drops Below $68K
- Expert Says Bitcoin Now in ‘Stage 4’ Bear Market Phase, Warns BTC May Hit 35K to 45K Zone
- Bitcoin Price Today As Bulls Defend $65K–$66K Zone Amid Geopolitics and Tariffs Tensions
- COIN Stock Price Prediction: Will Coinbase Crash or Rally in Feb 2026?
- Shiba Inu Price Feb 2026: Will SHIB Rise Soon?
- Pi Network Price Prediction: How High Can Pi Coin Go?
- Dogecoin Price Prediction Feb 2026: Will DOGE Break $0.20 This month?
- XRP Price Prediction As SBI Introduces Tokenized Bonds With Crypto Rewards
- Ethereum Price Rises After SCOTUS Ruling: Here’s Why a Drop to $1,500 is Possible


