 Buy $GGs
Bitcoin price struggles to sustain the uptrend after losing support at $34,000. Dogecoin price consolidation continues, but a breakout is nigh.


- Bitcoin price struggles to sustain the uptrend after losing support at $34,000.
- Dogecoin price consolidation continues, but a breakout is nigh.
The stalemate in the cryptocurrency market continues amid widespread consolidation. The mundane price actions provide minimal trading positions, especially for major cryptocurrencies such as Bitcoin.
Crypto assets are mainly in the red despite the sluggish price action. Ethereum leads by recording 6.5% in losses, followed closely by Binance Coin after dropping 4.5% in 24 hours. The situation is not different from the other altcoins with single-digit losses.
Bitcoin:-
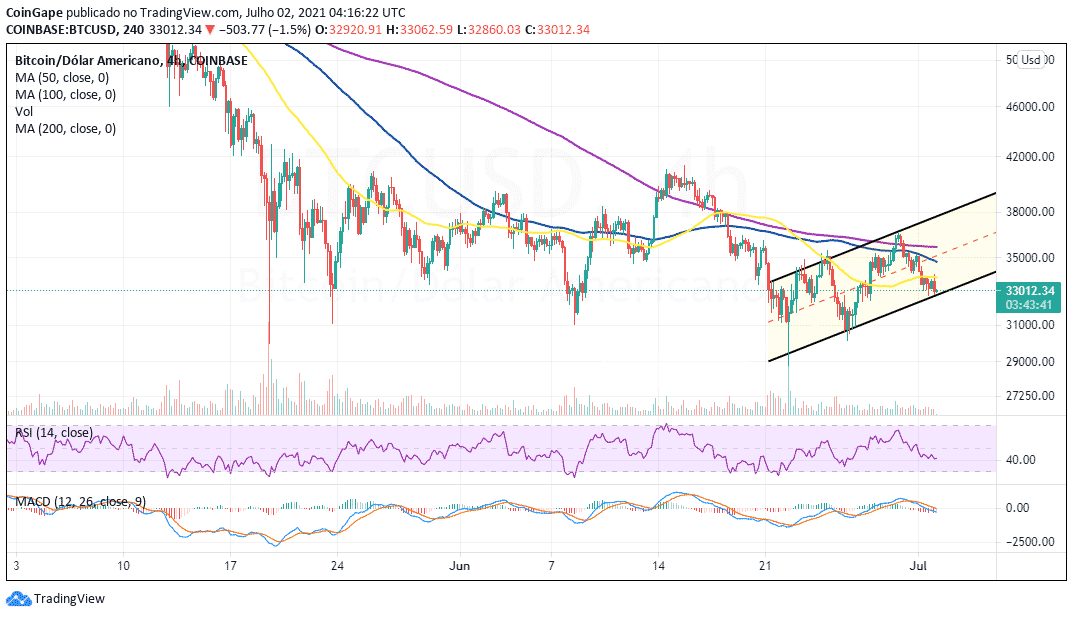
Bitcoin price has been downward after failing to hold above $36,000 earlier in the week. Key support at $34,000 flipped into resistance on Thursday, with Bitcoin extending the bearish leg beneath $33,000.
An ascending parallel channel has started to mold on the four-hour chart. Perhaps, holding within the confines of the pattern will allow bulls to sustain the uptrend aiming for $40,000.
Meanwhile, the short-term technical picture has flipped bearish, as illustrated by a recent sell signal from the Moving Average Convergence Divergence (MACD) indicator.
As the 12-day EMA crossed beneath the 26-day EMA, more sellers joined the market. Similarly, the bearish outlook has been reinforced by the MACD crossing under the mean line (0.00). On the downside, support is expected at $32,000 while further losses will be halted at $30,000.
BTC/USD four-hour chart
Dogecoin:-
Dogecoin price consolidation continues to stretch to the second week after bulls ran out of steam to break the hurdle at $0.28. On the downside, robust support has been established at $0.24, allowing stability to prevail in the market.
The meme coin is trading at $0.24 and within squeezing Bollinger bands. This technical tool follows the volatility of the asset and gives insight into possible breakouts. The tighter the constriction, the larger the breakout. However, the direction of the breakout is not determined by the Bollinger bands.
DOGE/USD four-hour chart
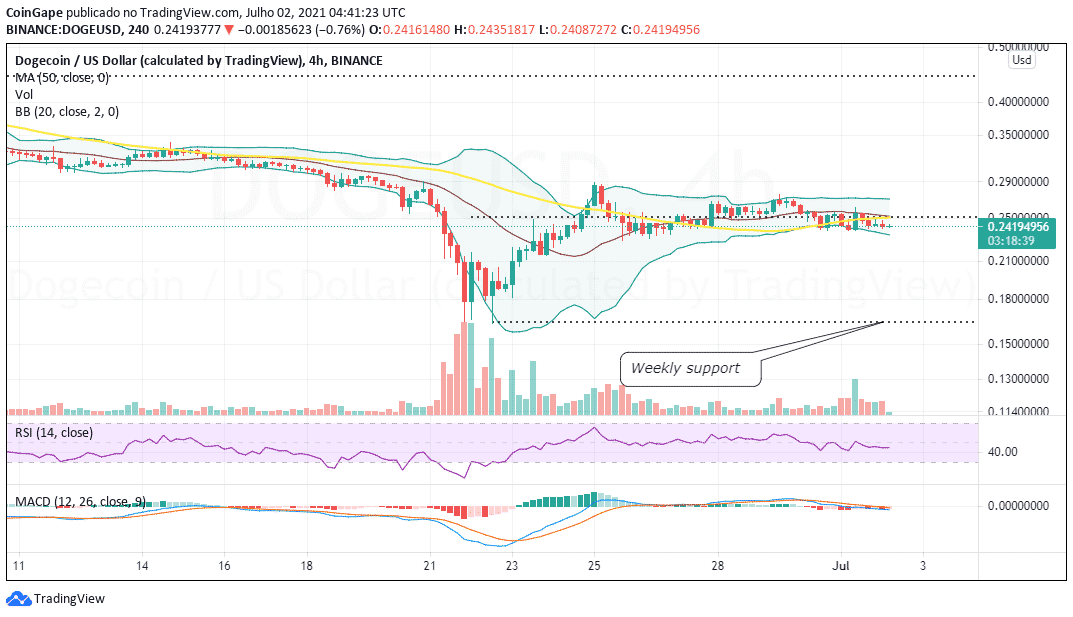
Therefore, a break above the middle boundary resistance, which the 50 SMA reinforces, could allow bulls to push for gains above $0.3. On the flip side, closing the day under $0.24 could validate the downswing back to $0.16.
Play 10,000+ Casino Games at BC Game with Ease
- Instant Deposits And Withdrawals
- Crypto Casino And Sports Betting
- Exclusive Bonuses And Rewards


Why Trust CoinGape
CoinGape has covered the cryptocurrency industry since 2017, aiming to provide informative insights Read more… to our readers. Our journal analysts bring years of experience in market analysis and blockchain technology to ensure factual accuracy and balanced reporting. By following our Editorial Policy, our writers verify every source, fact-check each story, rely on reputable sources, and attribute quotes and media correctly. We also follow a rigorous Review Methodology when evaluating exchanges and tools. From emerging blockchain projects and coin launches to industry events and technical developments, we cover all facets of the digital asset space with unwavering commitment to timely, relevant information.

Delivered every day.
- Insights that move markets
- 100,000 active subscribers
Related Articles


- US-Iran War: Reports Confirm Bombings In UAE, Bahrain and Kuwait As Crypto Market Makes Recovery
- XRP Price Dips on US-Iran Conflict, But Capitulation Signals March Rebound
- Crypto Market at Risk as U.S.–Iran War Threatens Inflation With Oil Price Surge
- Polymarket U.S.–Iran Strike Bets Fuel Insider Trading Speculation as Crypto Traders Net $1.2M
- Cardano’s DeFi TVL Climbs as USDCx Stablecoin Launches on Network
- Analysts Predict Where XRP Price Could Close This Week – March 2026
- Top Analyst Predicts Pi Network Price Bottom, Flags Key Catalysts
- Will Ethereum Price Hold $1,900 Level After Five Weeks of $563M ETF Selling?
- Top 2 Price Predictions Ethereum and Solana Ahead of March 1 Clarity Act Stablecoin Deadline
- Pi Network Price Prediction Ahead of Protocol Upgrades Deadline on March 1
- XRP Price Outlook As Jane Street Lawsuit Sparks Shift in Morning Sell-Off Trend


