 Buy $GGs
LINK Price Analysis: Chainlink price reclaims 200-day EMA, Emerging trendline Suggests More Upward Price Movement


The Chainlink (LINK) token is one of the few crypto coins that are thriving during the ongoing crypto market correction. The LINK price chart shows several lower price rejection candles in the daily chart, indicating the instant recovery from the market buyers. The price is steadily moving up with the hope of challenging the next higher resistance(27.8).
Key technical points:
- The LINK price reclaim the 200-day EMA
- The daily-MACD indicator’s lines jumps above the neutral zone
- The 24-hour trading volume in the Chainlink token coin is $3.2 Billion, indicating a 6.2% gain.
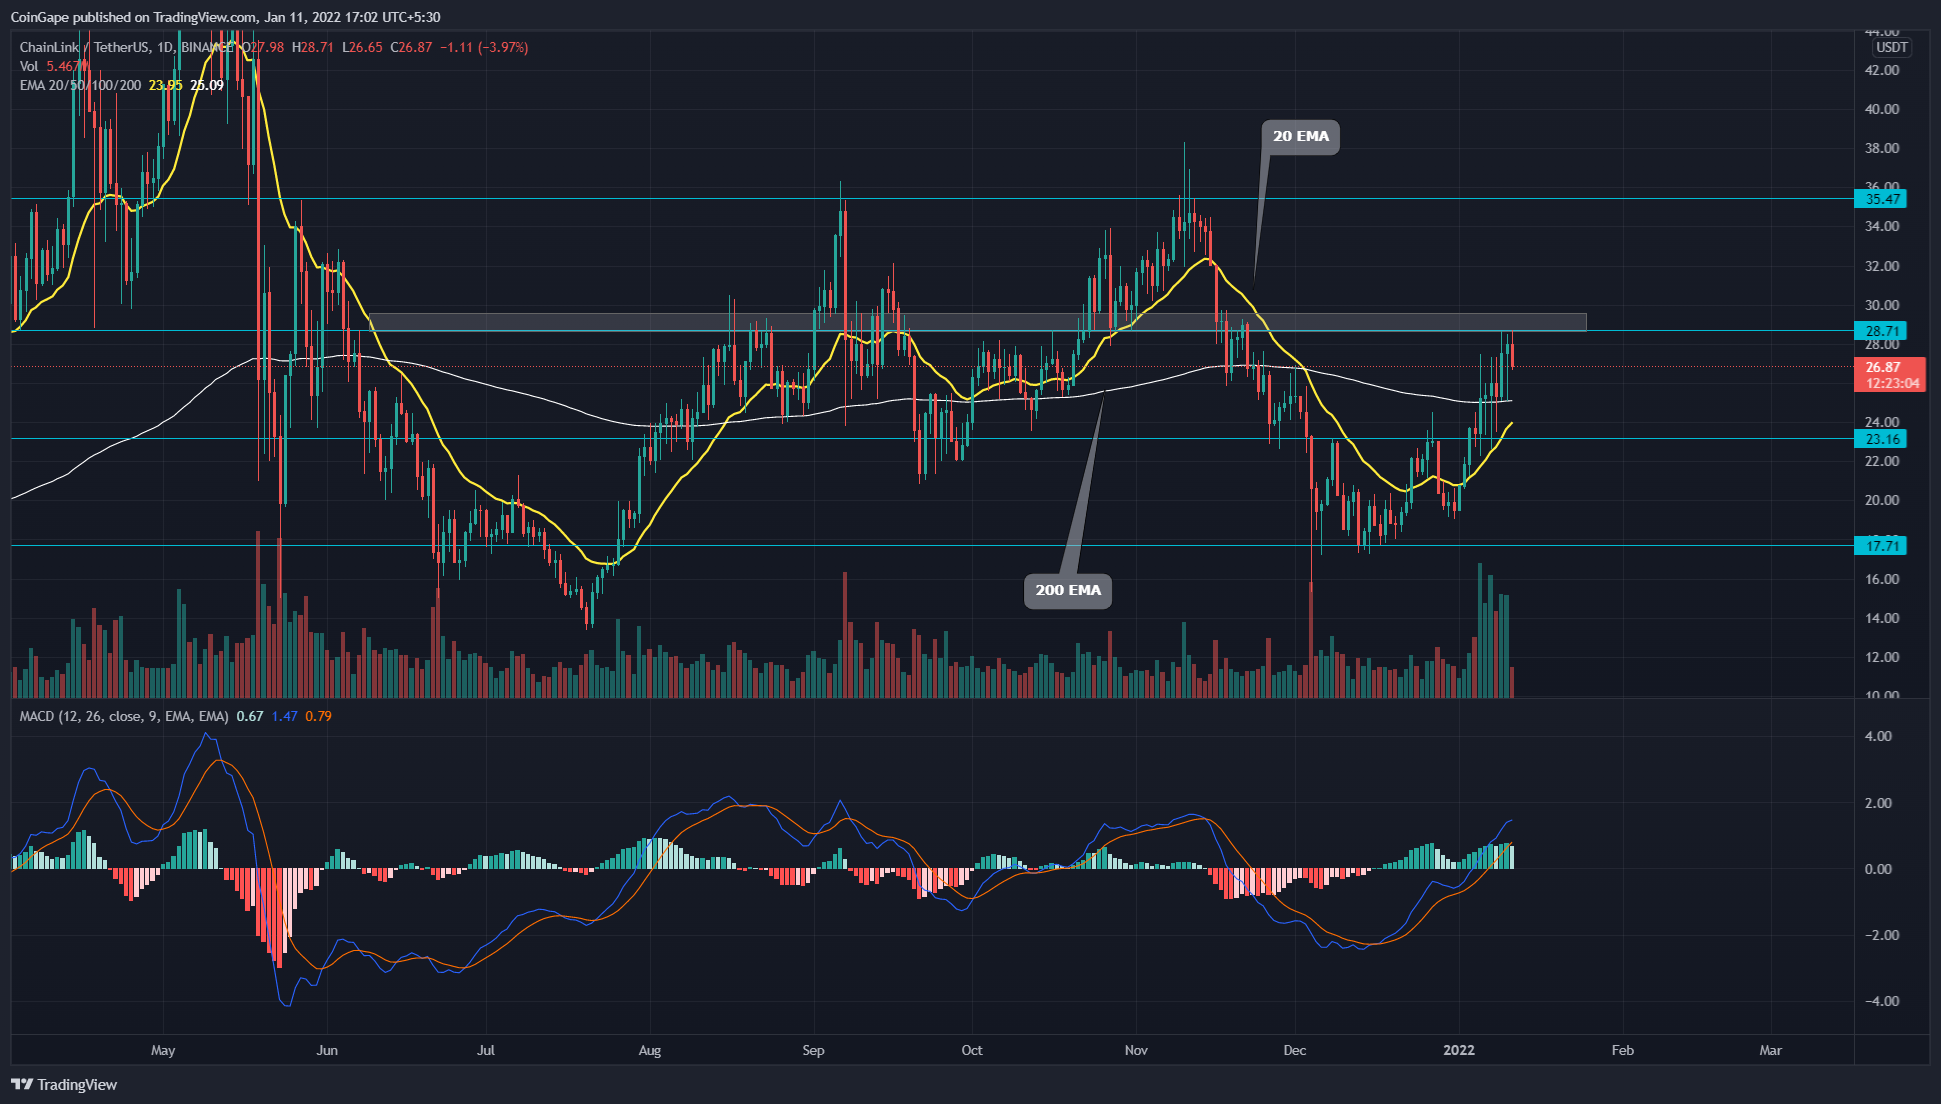 Source- Tradingview
Chainlink (LINK) token on December 27th was about to breach the $23.16 resistance. However, before it could give a decent breakout from this level, the intense supply pressure demanded a minor correction.
On January 3rd, the coin managed to reclaim its overhead resistance and provided a proper signal for bullish recovery. The price started to march higher, and even though the crypto market was suffering from a bloodbath, the LINK token kept its recovery intact and reached the $28.7 mark.
The new rally in the ChainLink (LINK) token has crossover above the 200 EMA, providing an excellent edge to the long traders. Moreover, the chart also shows a bullish crossover of the 20 and 50 EMA, attracting more buyers for this token.
The Moving average convergence divergence indicator shows the MACD and signal lines have crossed above the neutral zone, indicating a bullish momentum in the price.
Upcoming Trendline Serves As Dynamic Support For LINK Token
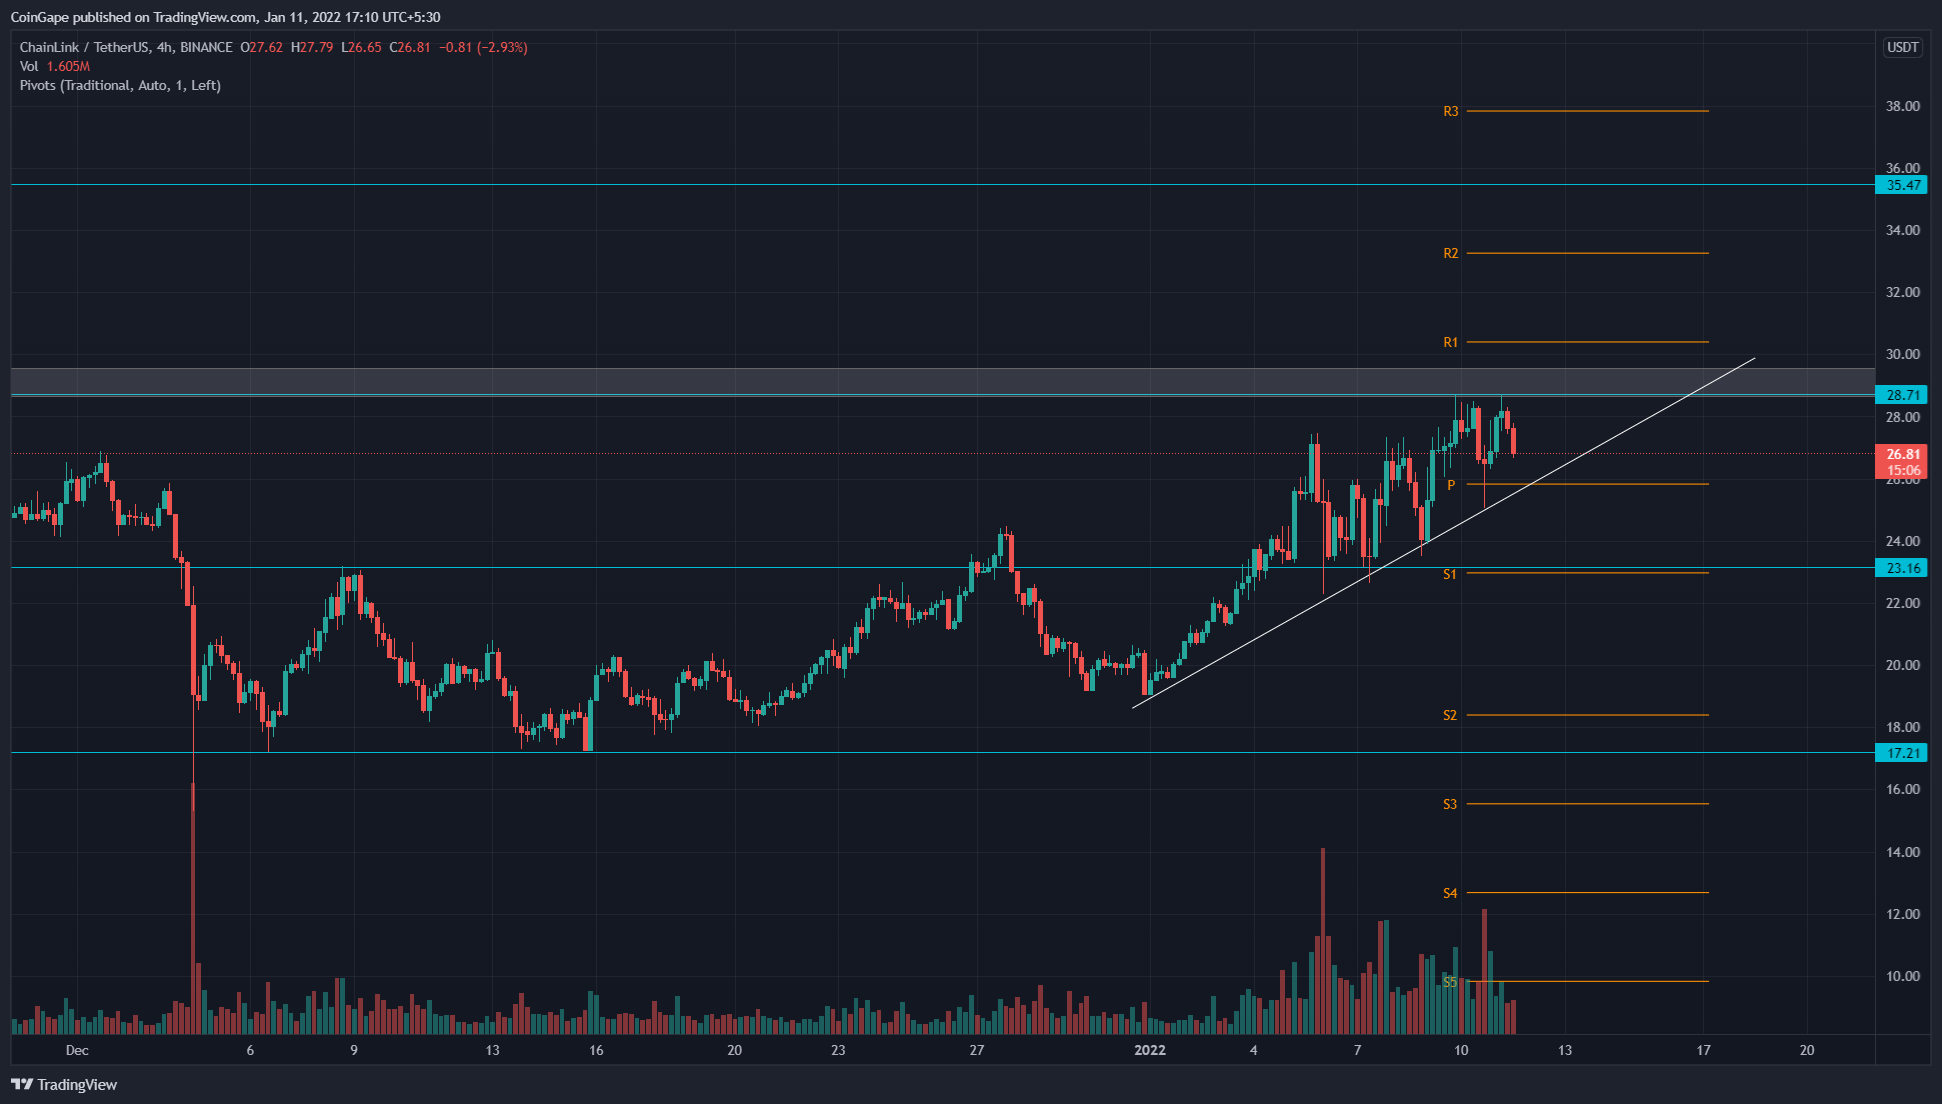 Source- Tradingview
The LINK price is currently experiencing strong resistance from the $27.8. The price was rejected from this level with an evening star pattern, hinting at a bullish reversal. However, the technical chart shows an emerging trendline, which provides dynamic support to the price.
The crypto traders can maintain strong bullish sentiment, until the support trendline is intact.
As per the traditional pivot level suggest the overhead resistance levels for LINK price are at $30, followed by $33.3. As for the opposite side, the support levels are $25.8 and $23.
Play 10,000+ Casino Games at BC Game with Ease
- Instant Deposits And Withdrawals
- Crypto Casino And Sports Betting
- Exclusive Bonuses And Rewards


Why Trust CoinGape
CoinGape has covered the cryptocurrency industry since 2017, aiming to provide informative insights Read more… to our readers. Our journal analysts bring years of experience in market analysis and blockchain technology to ensure factual accuracy and balanced reporting. By following our Editorial Policy, our writers verify every source, fact-check each story, rely on reputable sources, and attribute quotes and media correctly. We also follow a rigorous Review Methodology when evaluating exchanges and tools. From emerging blockchain projects and coin launches to industry events and technical developments, we cover all facets of the digital asset space with unwavering commitment to timely, relevant information.

Delivered every day.
- Insights that move markets
- 100,000 active subscribers
Related Articles


- US-Iran War: Reports Confirm Bombings In UAE, Bahrain and Kuwait As Crypto Market Makes Recovery
- XRP Price Dips on US-Iran Conflict, But Capitulation Signals March Rebound
- Crypto Market at Risk as U.S.–Iran War Threatens Inflation With Oil Price Surge
- Polymarket U.S.–Iran Strike Bets Fuel Insider Trading Speculation as Crypto Traders Net $1.2M
- Cardano’s DeFi TVL Climbs as USDCx Stablecoin Launches on Network
- Top Analyst Predicts Pi Network Price Bottom, Flags Key Catalysts
- Will Ethereum Price Hold $1,900 Level After Five Weeks of $563M ETF Selling?
- Top 2 Price Predictions Ethereum and Solana Ahead of March 1 Clarity Act Stablecoin Deadline
- Pi Network Price Prediction Ahead of Protocol Upgrades Deadline on March 1
- XRP Price Outlook As Jane Street Lawsuit Sparks Shift in Morning Sell-Off Trend
- Dogecoin, Cardano, and Chainlink Price Prediction As Crypto Market Rebounds


