Chainlink, Uniswap Price Analysis: September 14, 2021


- Chainlink balances at $30, but the upside to $40 seems highly vulnerable.
- Uniswap leads cryptocurrency price recovery, accruing more than 11% in gains.
The struggle by the bulls to regain complete control of the market continues as the week makes haste to the tail end. Bitcoin has taken back some key lost levels in the previous crash and has now settled above $47,000. Similarly, Ethereum is trading above $3,400 after testing support at $3,000 last week. Note that despite the progress seen in the previous week, the market is still in the red, according to CoinGecko.
Chainlink:
On Wednesday, Chainlink is among the few best-performers in the market, having accrued more than 10% in gains in the last 24 hours. The token has attracted roughly $1.9 billion in trading volume in the same period and boasts $13.6 billion in market value.
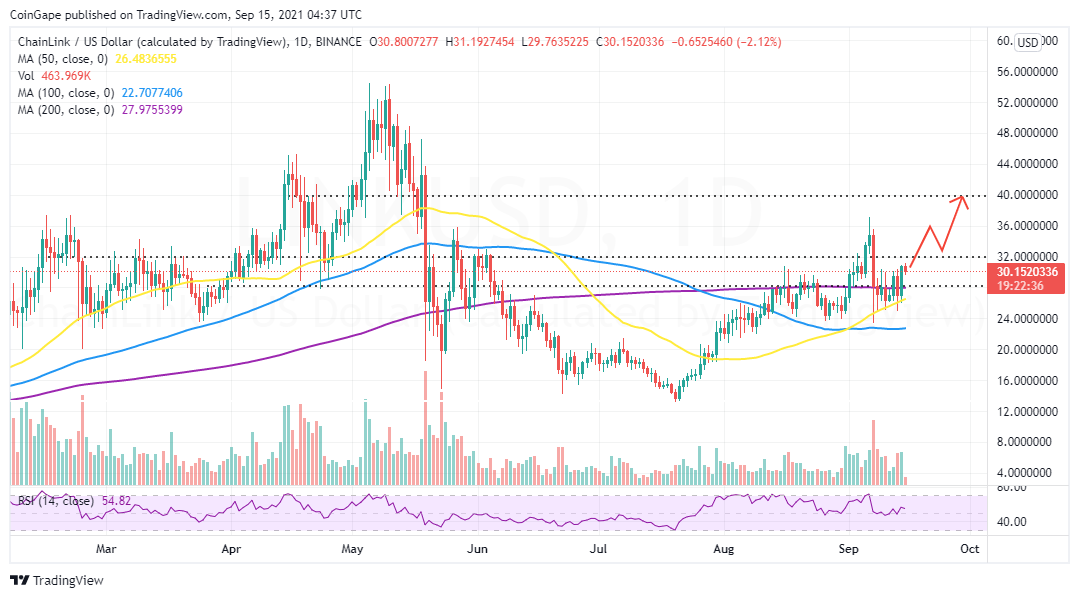
Live data from Binance shows that LINK is barely holding at $30 after rebounding from the recent support at $54. The 50-day Simple Moving Average (SMA) added credence to the support, allowing bulls to retake control.
However, by stepping above the 200-day SMA, Chainlink gained enough energy to take on the barrier at $30. It is worth noting that holding support at $30 remains crucial to sustaining the uptrend to $40, as shown on the chart. Meanwhile, some delay should be expected at $32, which, if broken, will bolster LINK closer to $40.
On the downside, a correction lingers as soon as Chainlink loses support at $30. The 200-day SMA at $28 and the 50 SMA are in line to prevent losses from revisiting $24.
LINK/USD Daily Chart
Uniswap:-
Like Chainlink, Uniswap is up a whopping 11%, even as the market stays mainly in the red. For some time, the decentralized finance (DeFi) token upside was capped under $24. Support at $20 came in handy, making sure that losses were mitigated.
The recent break above $24 left some bears rekt as UNI made a run for $30. However, the momentum fizzled put at the 50-day SMA. Uniswap is currently trading at 425.5 while buyers put up a fight to crack the immediate hurdle.
UNI/USD Daily Chart

The Moving Average Convergence Divergence (MACD) is about to flip bullish by sending a buy signal on the daily chart. This call to buy UNI will manifest as the 12-day EMA crosses above the 26-day EMA. Perhaps closing the day above the 50 SMA will bring UNI closer to trading at $30.

Why Trust CoinGape
CoinGape has covered the cryptocurrency industry since 2017, aiming to provide informative insights Read more… to our readers. Our journal analysts bring years of experience in market analysis and blockchain technology to ensure factual accuracy and balanced reporting. By following our Editorial Policy, our writers verify every source, fact-check each story, rely on reputable sources, and attribute quotes and media correctly. We also follow a rigorous Review Methodology when evaluating exchanges and tools. From emerging blockchain projects and coin launches to industry events and technical developments, we cover all facets of the digital asset space with unwavering commitment to timely, relevant information.

Delivered every day.
- Insights that move markets
- 100,000 active subscribers
Related Articles


- Michael Saylor Says Quantum Risk To Bitcoin Is a Decade Away, Describes it as ‘FUD’
- White House Proposes Stablecoin Rewards Compromise as CLARITY Act Odds Drop to 44%
- Trump’s Board Of Peace Eyes Dollar-Backed Stablecoin For Gaza Rebuild
- Trump’s World Liberty Financial Flags ‘Coordinated Attack’ as USD1 Stablecoin Briefly Depegs
- Trump Tariffs: U.S. Threatens Higher Tariffs After Supreme Court Ruling, BTC Price Falls
- COIN Stock Risks Crashing to $100 as Odds of US Striking Iran Jump
- MSTR Stock Price Predictions As Michael Saylor’s Strategy Makes 100th BTC Purchase
- Top 3 Meme Coins Price Prediction As BTC Crashes Below $67k
- Top 4 Reasons Why Bitcoin Price Will Crash to $60k This Week
- COIN Stock Price Prediction: Will Coinbase Crash or Rally in Feb 2026?
- Shiba Inu Price Feb 2026: Will SHIB Rise Soon?


