Helium And Fantom Gain Upto 13% – Crucial Price Levels On Target Next!


Helium and Fantom have constantly displayed appreciation. Over the last 24 hours, these coins have shot up more than 13%. Bitcoin’s northbound price trajectory has caused major altcoins to soar considerably. At press time, Bitcoin was trading extremely close to the $50k level, and this constant appreciation caused many major altcoins to follow the same path of registering gains in the past few days.
Over the past week, the crypto industry’s price action was extremely rocky. However, the last couple of days has been favorable as many coins could recover most of their lost market value
Helium/HNT/USD Four-Hour Chart
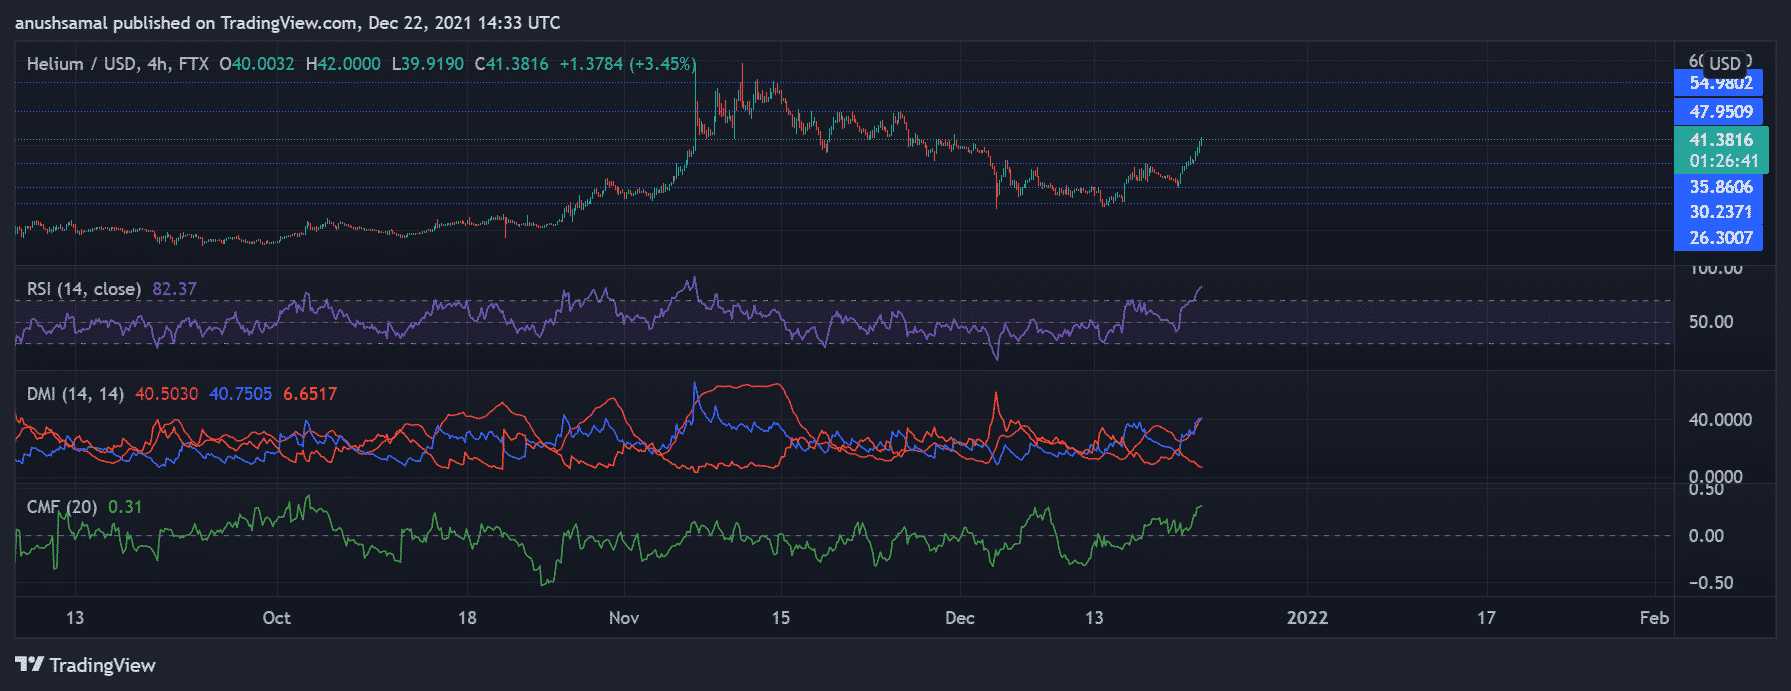
Helium’s price trajectory has been quite dynamic since the first week of November. Every time the coin dipped on its chart, the bulls have tried to push the prices up.
At press time, the coin was trading at $41.38 after registering a 13.7% growth in the last 24 hours. Immediate resistance for the coin stood at $47.95 and then at $54.90, while the support region stretched from $35.86 to $26.30.
The Relative Strength Index has reached the oversold zone as the coin has been overvalued over the last 24 hours. A chance of profit booking could cause a price reversal which would then cause buying pressure to dip and selling pressure to heighten.
The Directional Movement Index showed a strong uptrend as the +DI line was spotted above the -DI line. Chaikin Money Flow also depicted increased capital inflows over outflows at press time.
FTM/USD Four-Hour Chart
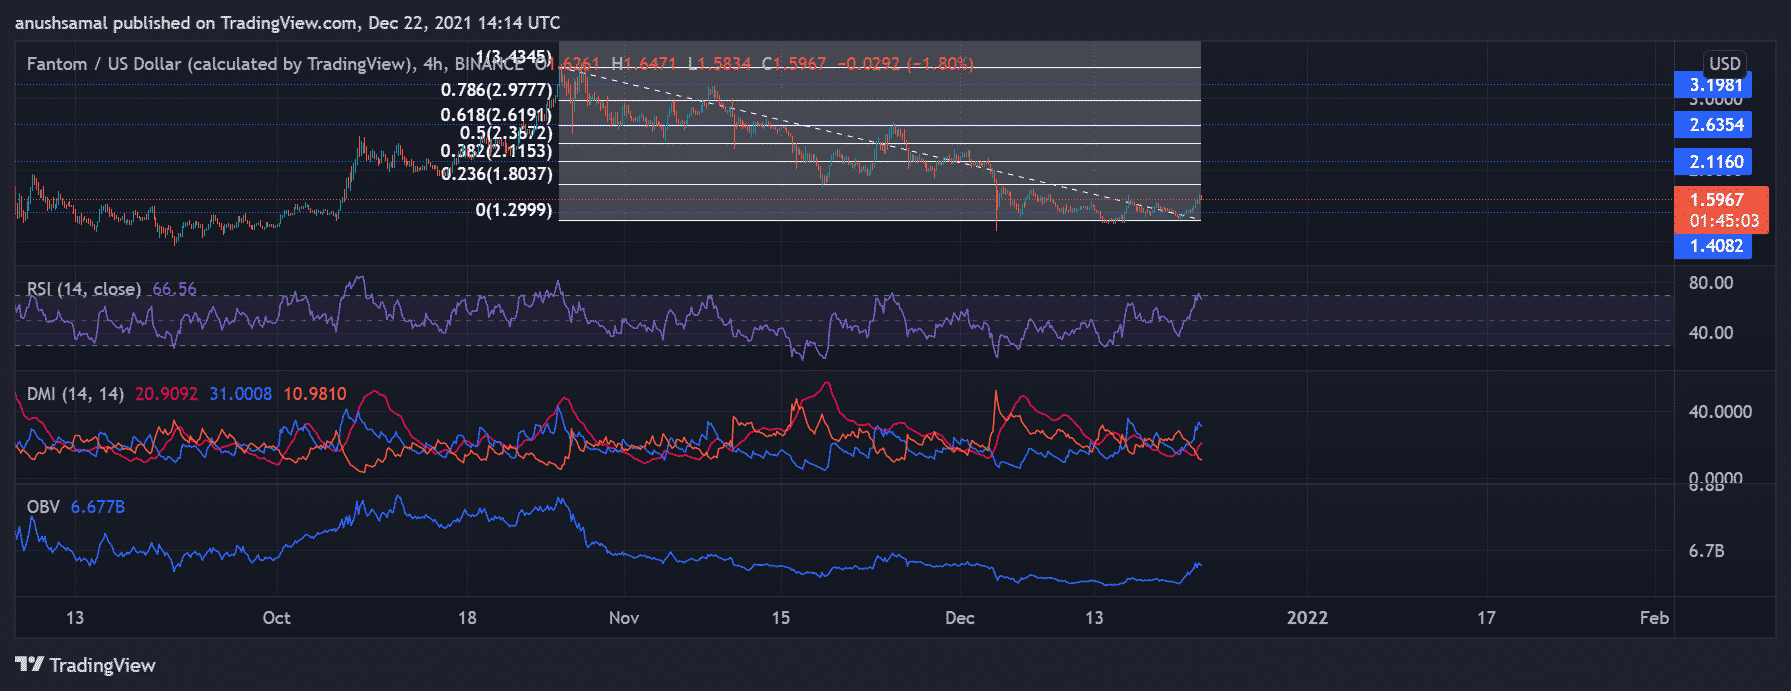
Fantom was trading at $1.59 after a major pullback in prices, which the coin had encountered at the 78.6% Fibonacci level. Fantom’s prices shot up by over 13% in the past day. The coin’s technical outlook highlighted an extreme bullish pressure.
Immediate price resistance for the coin, if Fantom extends its gains, could be at $2.11, whereas a price reversal could cause the prices to fall below near the $1.40. The trading volume of Fantom also saw an appreciation over the last 24 hours.
The Relative Strength Index preferred the bulls as the indicator was seen at the 75-mark, which meant that FTM was overvalued at the time of writing.
The Directional Movement Index also saw a bullish bias with a +DI line above the -DI line. On Balance, Volume had also shot up as bullish strength mounted, indicating an increased buying strength.

Why Trust CoinGape
CoinGape has covered the cryptocurrency industry since 2017, aiming to provide informative insights Read more… to our readers. Our journal analysts bring years of experience in market analysis and blockchain technology to ensure factual accuracy and balanced reporting. By following our Editorial Policy, our writers verify every source, fact-check each story, rely on reputable sources, and attribute quotes and media correctly. We also follow a rigorous Review Methodology when evaluating exchanges and tools. From emerging blockchain projects and coin launches to industry events and technical developments, we cover all facets of the digital asset space with unwavering commitment to timely, relevant information.

Delivered every day.
- Insights that move markets
- 100,000 active subscribers


