 Buy $GGs
Ethereum Classic [ETC] Price Spikes 4% In A Day, Possible Spike To $11.00 USD Or A Bull Trap?


- Ethereum Classic (ETC) on the verge of breaching key resistance at $10.00 USD, as price spikes 4% in a day.
- Higher timeframe charts MACD, RSI, Elliot Wave technical indicators signal a long term bearish view on the ETC/USD pair.
Ethereum Classic is arguably one of the top cryptocurrencies of 2020 following a successful Agatha hard fork, an appreciation to $13.00 USD on Jan. 17, and a break into the top 10 for the first time in over a year. Following the spike to yearly highs, the bears took control of the market setting the price back to sub-$10 USD levels, as major crypto exchanges price a token of ETC at $9.638 USD, as at time of writing.
ETC/USD on the verge of breaching key resistance at $11.00 USD
Since spiking to $13.00, the price reversed to $7.78 USD a week later and bounced off the rising wedge channel support, to start its journey to $10 USD. Only a few cents away, the mark looks set to be breached with near term indicators, bullish. Having touched an intraday trading high of $3.845 USD on Coinbase, ETC/USD has slowed its pace to current prices as bulls prepare for a possible bullish run in the near term.
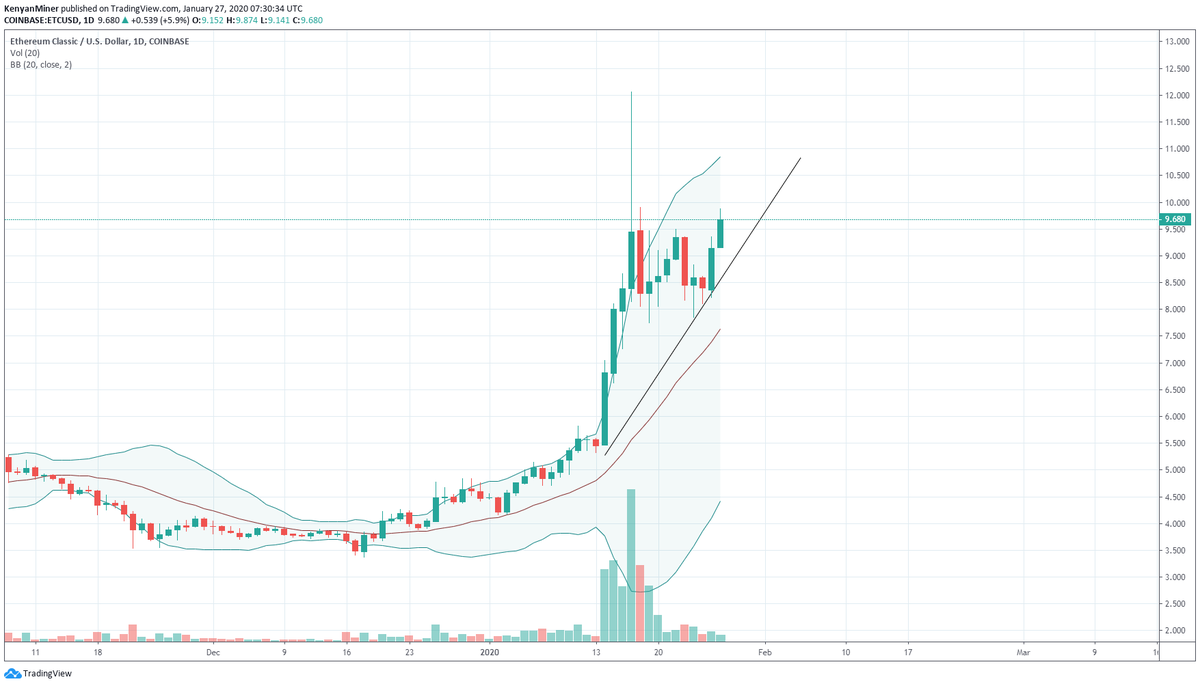
The market is firmly poised in the upper half of the 20-day Bollinger Bands, with the upper band providing near term resistance. If bulls are able to breach the key resistance at $9.916 USD, the market will effectively threaten a move towards higher resistance levels at $10.00 USD and $10.80 USD in the coming days.
Furthermore, the upcoming halving in March is causing a decrease in the natural supply of the tokens. This provides bullish fundamental principle arguments for strongly bullish investors.
Halving’s are VERY BULLISH in the #cryptocurrency market
2020 Halving’s $ETC March, 2020 (+107% last month)$BCH April, 2020 $BTC May, 2020$DASH May, 2020$ZEC October, 2020 #BitcoinCash is next#Zcash is a big play, it’s having its 1st halving this year ? #BULLISH https://t.co/ElZqoTJWV1
— CryptoCurrency ? (@crypto_goat_) January 26, 2020
Is this a bull trap?
The past few days in the cryptocurrency field has been nothing short of confusing. Bitcoin (BTC) is yet to show any clear direction heading into the halving. ETC long term indicators are giving mixed signals as the daily MACD narrows to form a death cross. Completion of the pattern will start off a selling spree that may push the price back to the key support provided by BB middle line at $7.50 USD.
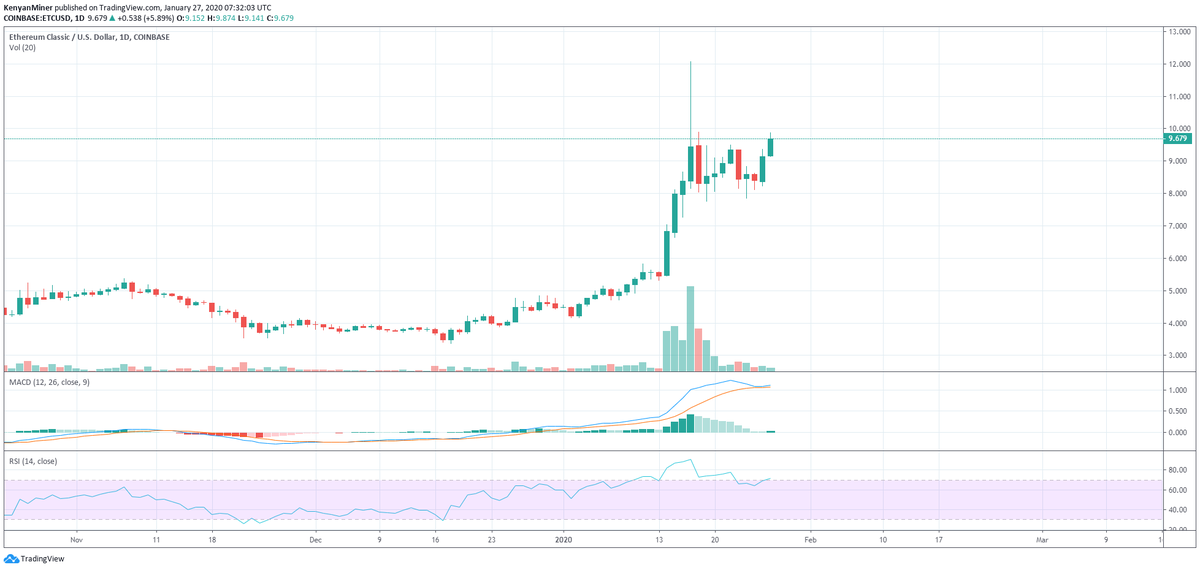
Notwithstanding, the decreasing volumes do not offer a solid bullish stance in the long term. The higher time frame relative strength index (RSI) charts show the token is slightly overbought at 71 hence a possible consolidation period may be on the way.
Play 10,000+ Casino Games at BC Game with Ease
- Instant Deposits And Withdrawals
- Crypto Casino And Sports Betting
- Exclusive Bonuses And Rewards


Why Trust CoinGape
CoinGape has covered the cryptocurrency industry since 2017, aiming to provide informative insights Read more… to our readers. Our journal analysts bring years of experience in market analysis and blockchain technology to ensure factual accuracy and balanced reporting. By following our Editorial Policy, our writers verify every source, fact-check each story, rely on reputable sources, and attribute quotes and media correctly. We also follow a rigorous Review Methodology when evaluating exchanges and tools. From emerging blockchain projects and coin launches to industry events and technical developments, we cover all facets of the digital asset space with unwavering commitment to timely, relevant information.

Delivered every day.
- Insights that move markets
- 100,000 active subscribers
Related Articles


- Bitget Rolls Out Group-Based Maker Rates to Boost Liquidity Across Spot and Futures
- Kraken Gains Access To The Federal Reserve’s Payment System as Ripple Awaits Approval
- “There Is Only One Gold,” Billionaire Ray Dalio Says Amid BTC’s Quantum Threats
- Goldman Sachs CEO Predicts ‘Weeks’ of Crypto Market Crash as U.S Iran War Continues
- Polymarket Axes ‘Nuclear Detonation’ Prediction Market Amid Public Fury
- Robinhood Stock Price Prediction As Cathie Wood Buys $12M Dip in Bold ARK Move
- Bitcoin Price At Risk? Professor Who Predicted US-Iran War Says America Could Lose
- Gold Price Prediction March 2026: Rally, Crash, or Record Highs?
- RIOT Stock Prediction as Needham, Piper Sandler Slash Target After Earnings
- Cardano Price Outlook As Charles Hoskinson Warns Over CLARITY Act
- Circle Stock Price Climbs 15% to $96, Can Rally Continue in March 2026?


