 Buy $GGs
HBAR Price Analysis: Hedera Hashgraph ($HBAR) Prints New All Time High, Can HBAR Break $1?


- HBAR price is up nearly 95% over the last week
- HBAR Price has formed an ascending channel
- 25 MA has continued to act as support
Can HBAR Take Over $1?
Hedera Hashgraph (HBAR) has been outperforming the overall crypto market over the last week as prices have risen nearly 100% from $0.24 to $0.49. HBAR refers to itself as the “trust layer of the internet”. Hedera is a public network that allows individuals and businesses to create powerful decentralized applications (Dapps).
HBAR has been growing in popularity & market cap rankings as its now the 39th largest cryptocurrency. HBAR was designed to be a fairer, more efficient system that eliminates the limitations that older blockchains face.
Ever since the large market fall that occurred on September 7th, HBAR has been on an immensely strong uptrend. This uptrend has pushed HBAR price to a new all time high of $0.49. Throughout this period, HBAR price has formed an ascending channel formation (shown in light blue). The top trend of this channel has acted as a major resistance as each time price has reached it, it has gotten rejected back down to the median line of the channel (shown in red).
At the time of writing, HBAR price is trading within a major resistance zone of $0.45-$0.486. If bulls manage to break & hold this zone, we should expect price to reach the target given.
Hedera Hashgraph Price Analysis: HBAR/USDT 4 Hour Chart
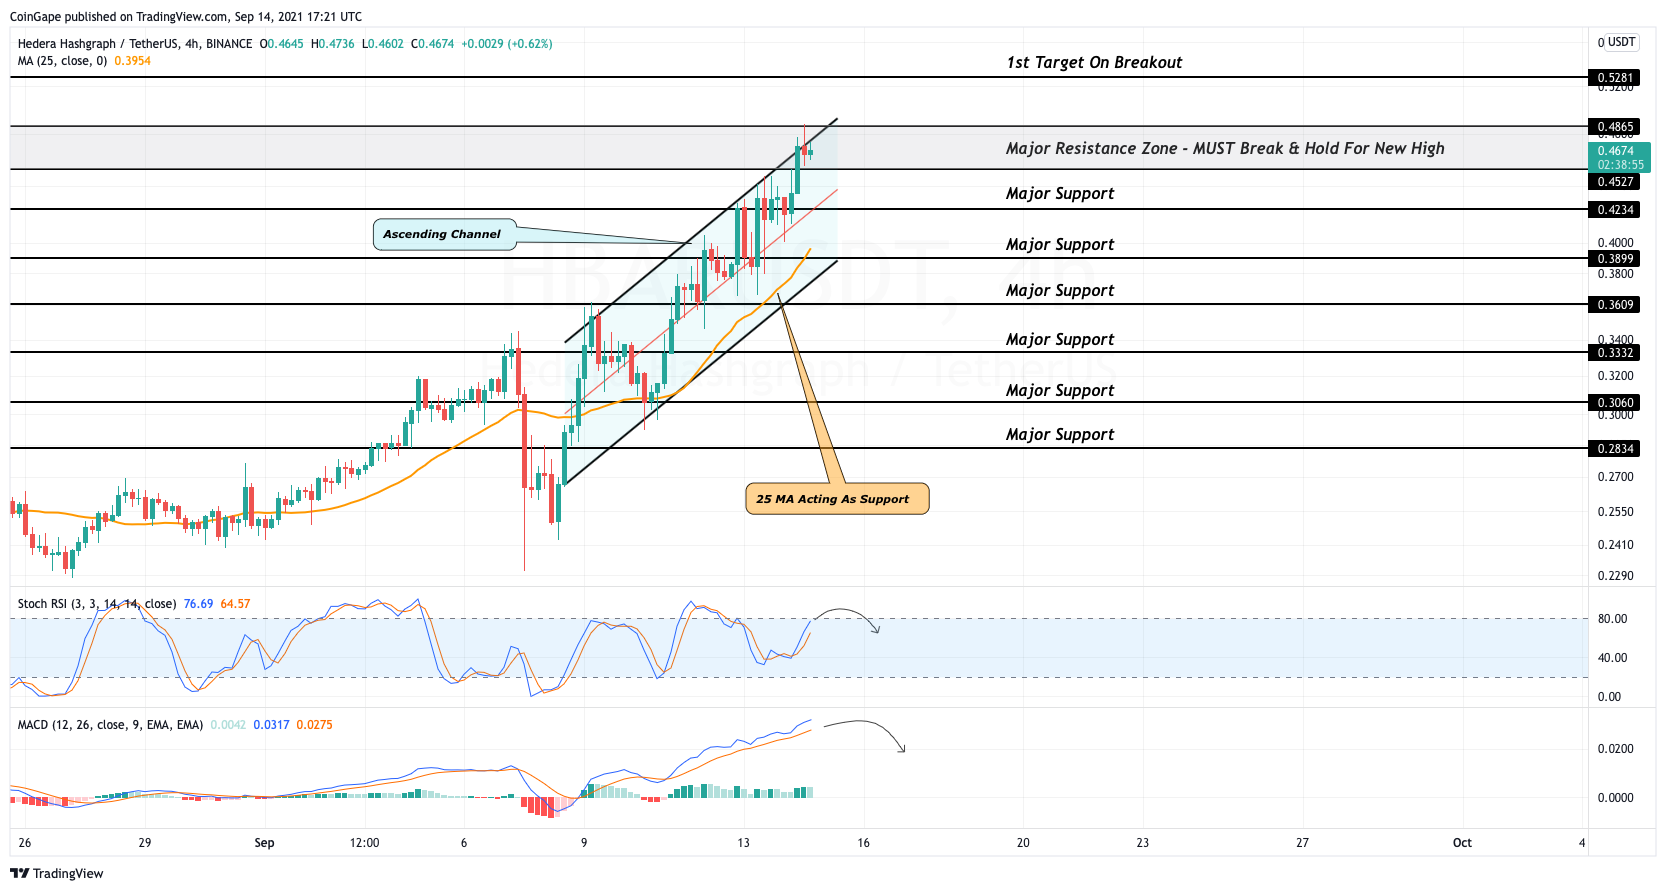
Throughout this run up over the last week, HBAR price has only touched the bottom trend of its ascending channel once. This shows that bulls are immensely in control as price continues to hug the top trend of its channel. At the time of writing, Hedera Hashgraph is trading above a minor support of $0.45.
If bulls lose power & HBAR price gets pulled below this mark, expect prices to drop to the major support of $0.423. If this level fails to hold, expect price to drop further to the major support of $0.389. This would bring HBAR price to the bottom trend of its channel. Along with this trend lies the 25MA. This MA has held for nearly a week now & a break below will likely cause a bearish trend change.
- While looking at the Stochastic RSI, we can see strength is now heading towards the overbought region. If strength continues higher & enters within this zone, HBAR price may be in for a push to a new all time high.
- The MACD has been stuck within a linear uptrend for the past few days. This continues bullish until the blue MA crossed below the orange MA.
HBAR Intraday Analysis
- Spot rate: $0.467
- Trend: Bullish
- Volatility: Medium
- Support: $0.4527
- Resistance: $0.486
Play 10,000+ Casino Games at BC Game with Ease
- Instant Deposits And Withdrawals
- Crypto Casino And Sports Betting
- Exclusive Bonuses And Rewards


Why Trust CoinGape
CoinGape has covered the cryptocurrency industry since 2017, aiming to provide informative insights Read more… to our readers. Our journal analysts bring years of experience in market analysis and blockchain technology to ensure factual accuracy and balanced reporting. By following our Editorial Policy, our writers verify every source, fact-check each story, rely on reputable sources, and attribute quotes and media correctly. We also follow a rigorous Review Methodology when evaluating exchanges and tools. From emerging blockchain projects and coin launches to industry events and technical developments, we cover all facets of the digital asset space with unwavering commitment to timely, relevant information.

Delivered every day.
- Insights that move markets
- 100,000 active subscribers
Related Articles


- $2T Barclays Explores Blockchain For Stablecoin Payments and Tokenized Deposits
- Breaking: U.S. PPI Inflation Rises To 2.9%, BTC Price Falls
- XRP News: Ripple-Backed Ctrl Alt Completes $280M in Diamond Tokenization on XRPL
- Bitwise CIO Calls Bitcoin Selloff ‘Classic Cycle,’ Dismisses Manipulation Rumors
- Cardone Capital Takes Real Estate On-Chain With $5B Tokenization Plan
- Top Analyst Predicts Pi Network Price Bottom, Flags Key Catalysts
- Will Ethereum Price Hold $1,900 Level After Five Weeks of $563M ETF Selling?
- Top 2 Price Predictions Ethereum and Solana Ahead of March 1 Clarity Act Stablecoin Deadline
- Pi Network Price Prediction Ahead of Protocol Upgrades Deadline on March 1
- XRP Price Outlook As Jane Street Lawsuit Sparks Shift in Morning Sell-Off Trend
- Dogecoin, Cardano, and Chainlink Price Prediction As Crypto Market Rebounds


