 Buy $GGs
Injective (INJ) Price Soars By 10% Amid Crypto Crash


Amid a bearish sentiment prevailing in the crypto market over the past 24 hours, the Injective (INJ) token has managed to turn the tide in its favor. Major cryptocurrencies like Bitcoin, XRP, and Polygon have seen monthly lows, but INJ’s bullish momentum has defied the trend.
INJ Price Up by 10% in Last 24 Hrs
After hitting a monthly low of $6.75, support for the INJ token emerged, swiftly sweeping away the bearish momentum. Consequently, the INJ price skyrocketed to a 24-hour high of $7.96 before facing resistance. Currently, bullish sentiment remains robust in the INJ market, as the price surges by 7.08% from the previous day’s low to $7.81.
Breaking through the $7.96 resistance level could trigger further upward movement, possibly testing the next resistance at $8.50. However, should the bulls fail to penetrate this level, a consolidation phase or minor correction might soon be on the horizon.
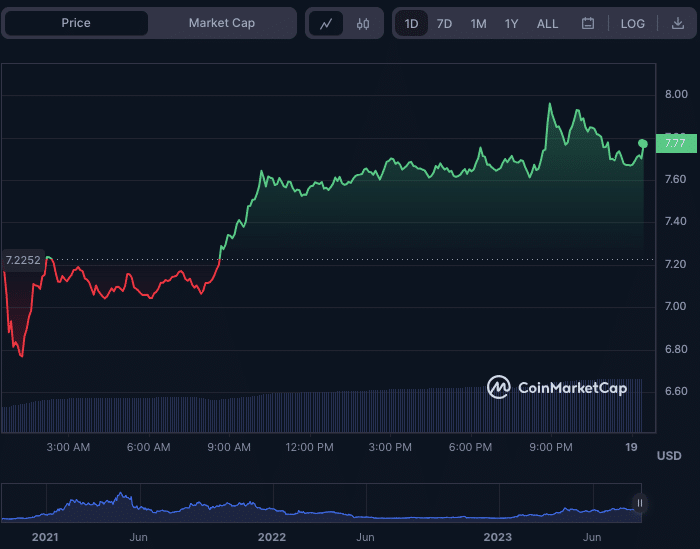
INJ/USD Source: CoinMarketCap
Significantly, INJ’s market capitalization and 24-hour trading volume have surged by 6.79% and 88.20%, respectively, to $650,481,444 and $101,814,365. This notable surge reflects heightened investor interest and activity in the token. The substantial rise in trading volume suggests a strong demand for INJ, which could contribute to further price appreciation.
INJ Price Prediction: Potential Short-term Pullback Looms
The Keltner Channel is widening on the INJUSD 2-hour price chart, with the upper, middle, and lower bars touching at 7.9431947, 7.4653180, and 6.9858837, respectively. This widening indicates a period of increased volatility and potential price movement. However, the formation of red candlesticks after hitting the upper band suggests a possible short-term pullback or correction in the price of INJ.
Moreover, the Relative Strength Index (RSI) rating of 59.08, which is pointing downwards, adds to the indication of a potential short-term pullback. A declining RSI suggests that buying pressure may weaken, supporting the possibility of a correction in the INJ token’s price. If the RSI continues to decline and falls below the 50 level, it could further confirm the likelihood of a short-term pullback.

INJ/USD 24-hour price chart (source: TradingView)
Additionally, the Money Flow Index (MFI) rating of 77.86, showing signs of decreasing, provides further evidence of a potential pullback in the INJ price. The MFI measures the inflow and outflow of money into an asset, and a declining MFI suggests that investors may be starting to sell off their positions. If the MFI continues to decrease and falls below the 70 level, it could reinforce the possibility of a correction in the token’s price.
While the INJ token has shown bullish momentum amidst a negative crypto market sentiment, technical indicators suggest a potential short-term pullback. Consequently, investors should exercise caution and stay tuned for further market developments.
Play 10,000+ Casino Games at BC Game with Ease
- Instant Deposits And Withdrawals
- Crypto Casino And Sports Betting
- Exclusive Bonuses And Rewards


Why Trust CoinGape
CoinGape has covered the cryptocurrency industry since 2017, aiming to provide informative insights Read more… to our readers. Our journal analysts bring years of experience in market analysis and blockchain technology to ensure factual accuracy and balanced reporting. By following our Editorial Policy, our writers verify every source, fact-check each story, rely on reputable sources, and attribute quotes and media correctly. We also follow a rigorous Review Methodology when evaluating exchanges and tools. From emerging blockchain projects and coin launches to industry events and technical developments, we cover all facets of the digital asset space with unwavering commitment to timely, relevant information.

Delivered every day.
- Insights that move markets
- 100,000 active subscribers
Related Articles


- XRP News: Institutional Use Case Expands as Doppler Finance Integrates WXRP for Multi-Chain Access
- Trump Tariffs: Bitcoin Faces Fresh Headwinds as 15% Global Tariffs Begin This Week Amid Iran War
- Bitget Unveils ‘Crypto Anti-Bias Pledge’ To Support Women’s Inclusion In Crypto
- U.S.-Iran War: Crypto Market Rebounds as Iran Reportedly Reaches Out To U.S. To End Conflict
- Bitget Rolls Out Group-Based Maker Rates to Boost Liquidity Across Spot and Futures
- COIN Stock Analysis as Bitcoin Retests $72k Ahead of February NFP Data
- Robinhood Stock Price Prediction As Cathie Wood Buys $12M Dip in Bold ARK Move
- Bitcoin Price At Risk? Professor Who Predicted US-Iran War Says America Could Lose
- Gold Price Prediction March 2026: Rally, Crash, or Record Highs?
- RIOT Stock Prediction as Needham, Piper Sandler Slash Target After Earnings
- Cardano Price Outlook As Charles Hoskinson Warns Over CLARITY Act


