 Buy $GGs
Litecoin Price Analysis: LTC Rebounds From THIS Trend Line As It Sets Sight To $50 Again


- Litecoin saw a 2% price increase over the past 24 hours of trading as the cryptocurrency reaches $46.
- The coin recently rebounded from strong support at a rising support trend line.
Litecoin saw a 2% price rise over the past 24 hours of trading as the cryptocurrency bounces from $44.62 to reach $46. The coin had rebounded from a rising support trend line which prevented Litecoin from unwinding further beneath $44.60.
The momentum has now shifted back into the bullish favor especially with the RSI rebounding from the 50 line to show that the buyers are unwilling to give up their control of the market momentum just yet.
Litecoin Price Analysis
LTC/USD – Daily CHART – SHORT TERM
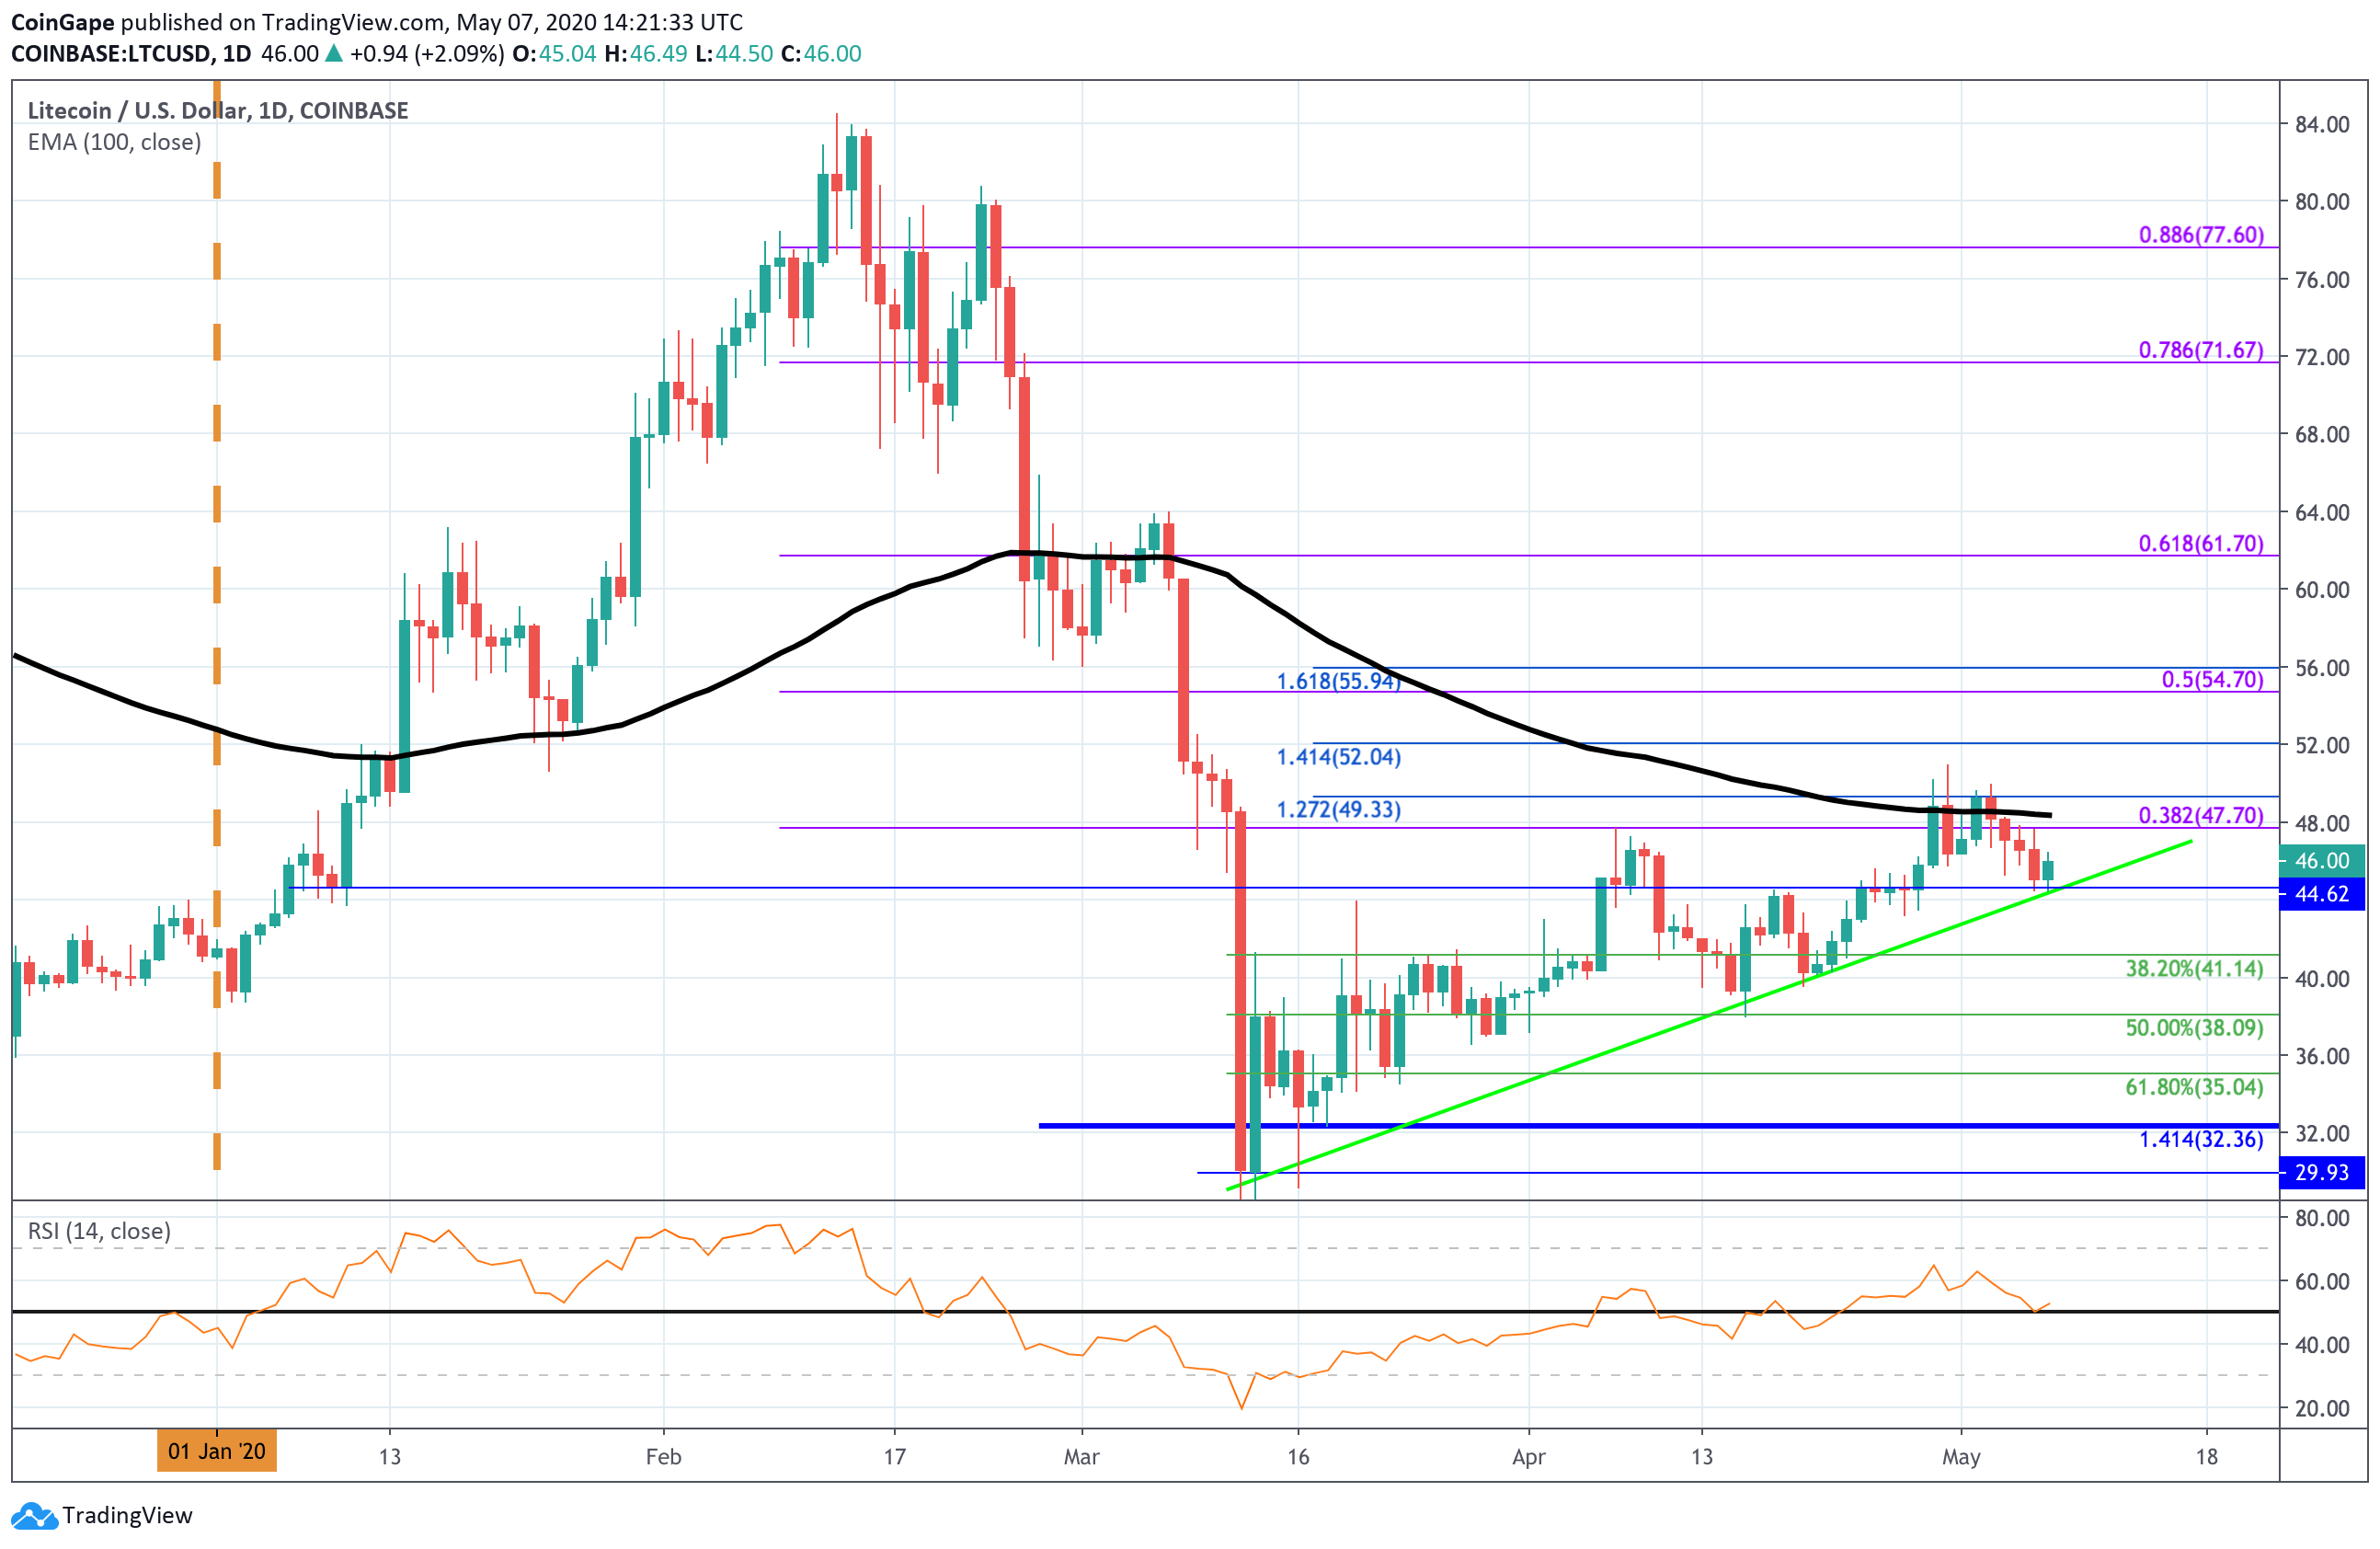
LTC/USD chart by TradingView
Market Overview
Analyzing the daily chart above, we can see that LTC had slipped beneath the 100-days at the start of the month after rolling over from the resistance at $49.33 (1.272 Fib Extension level). The coin continued to drop until recently hitting the support at $44.60 which was further bolstered by a rising support trend line.
Each time LTC reached this trend line the buyers managed to step back in to prevent the market from slipping further lower. This latest rebound should allow LTC to push higher and re-test the $50 level again.
Short term prediction: NEUTRAL
LTC still remains neutral and LTC would need to rise above $49.33 to turn bullish again. If the sellers push the market beneath the rising support trend line then we can consider the market as bearish in the short term.
Toward the upside, the first level of resistance lies at $47.70 which is provided by a bearish .382 Fib Retracement. This is followed immediately with resistance at the 100-day EMA. Above the 100-day EMA, resistance lies at $49.33 (1.272 Fib Extension), $50, and $52.04 (1.414 Fib Extension).
If the sellers push beneath the trend line, we can expect support to be located at $43 and $41.14 (.382 Fib Retracement). Beneath this, support lies at $40 and $38.09 (.5 Fib Retracement).
Key Levels
Support: $44.60, $43, $41.14, $40, $38.09.
Resistance: $47.70, $49.33, $50, $52.
Play 10,000+ Casino Games at BC Game with Ease
- Instant Deposits And Withdrawals
- Crypto Casino And Sports Betting
- Exclusive Bonuses And Rewards


Why Trust CoinGape
CoinGape has covered the cryptocurrency industry since 2017, aiming to provide informative insights Read more… to our readers. Our journal analysts bring years of experience in market analysis and blockchain technology to ensure factual accuracy and balanced reporting. By following our Editorial Policy, our writers verify every source, fact-check each story, rely on reputable sources, and attribute quotes and media correctly. We also follow a rigorous Review Methodology when evaluating exchanges and tools. From emerging blockchain projects and coin launches to industry events and technical developments, we cover all facets of the digital asset space with unwavering commitment to timely, relevant information.

Delivered every day.
- Insights that move markets
- 100,000 active subscribers
Related Articles


- Peter Brandt Flips Bullish, Predicts Bitcoin Rally As Price Holds Above $70k
- XRP News: Institutional Use Case Expands as Doppler Finance Integrates WXRP for Multi-Chain Access
- Trump Tariffs: Bitcoin Faces Fresh Headwinds as 15% Global Tariffs Begin This Week Amid Iran War
- Bitget Unveils ‘Crypto Anti-Bias Pledge’ To Support Women’s Inclusion In Crypto
- U.S.-Iran War: Crypto Market Rebounds as Iran Reportedly Reaches Out To U.S. To End Conflict
- COIN Stock Analysis as Bitcoin Retests $72k Ahead of February NFP Data
- Robinhood Stock Price Prediction As Cathie Wood Buys $12M Dip in Bold ARK Move
- Bitcoin Price At Risk? Professor Who Predicted US-Iran War Says America Could Lose
- Gold Price Prediction March 2026: Rally, Crash, or Record Highs?
- RIOT Stock Prediction as Needham, Piper Sandler Slash Target After Earnings
- Cardano Price Outlook As Charles Hoskinson Warns Over CLARITY Act


