 Buy $GGs
Litecoin Suffers 6% Price Decline As Outlook Suggests Potential Drop Toward $36.50


- Litecoin plummetted by a total of 5.6% today as the cryptocurrency crashes into the $40 level.
- The cryptocurrency failed to overcome resistance at the $44.60 level over the weekend which caused the market to roll over.
Litecoin dropped by a total of 5.6% over the past 24 hours of trading as it drops into support at $40. The support is here provided by a month-long rising trend line.
The cryptocurrency had climbed into resistance at $44.62 over the weekend and was unable to break above this resistance which caused the market to roll over and tumble.
It is now trading at support provided by a rising trend line but a break beneath this could cause Litecoin to drop toward $33.80.
Litecoin Price Analysis
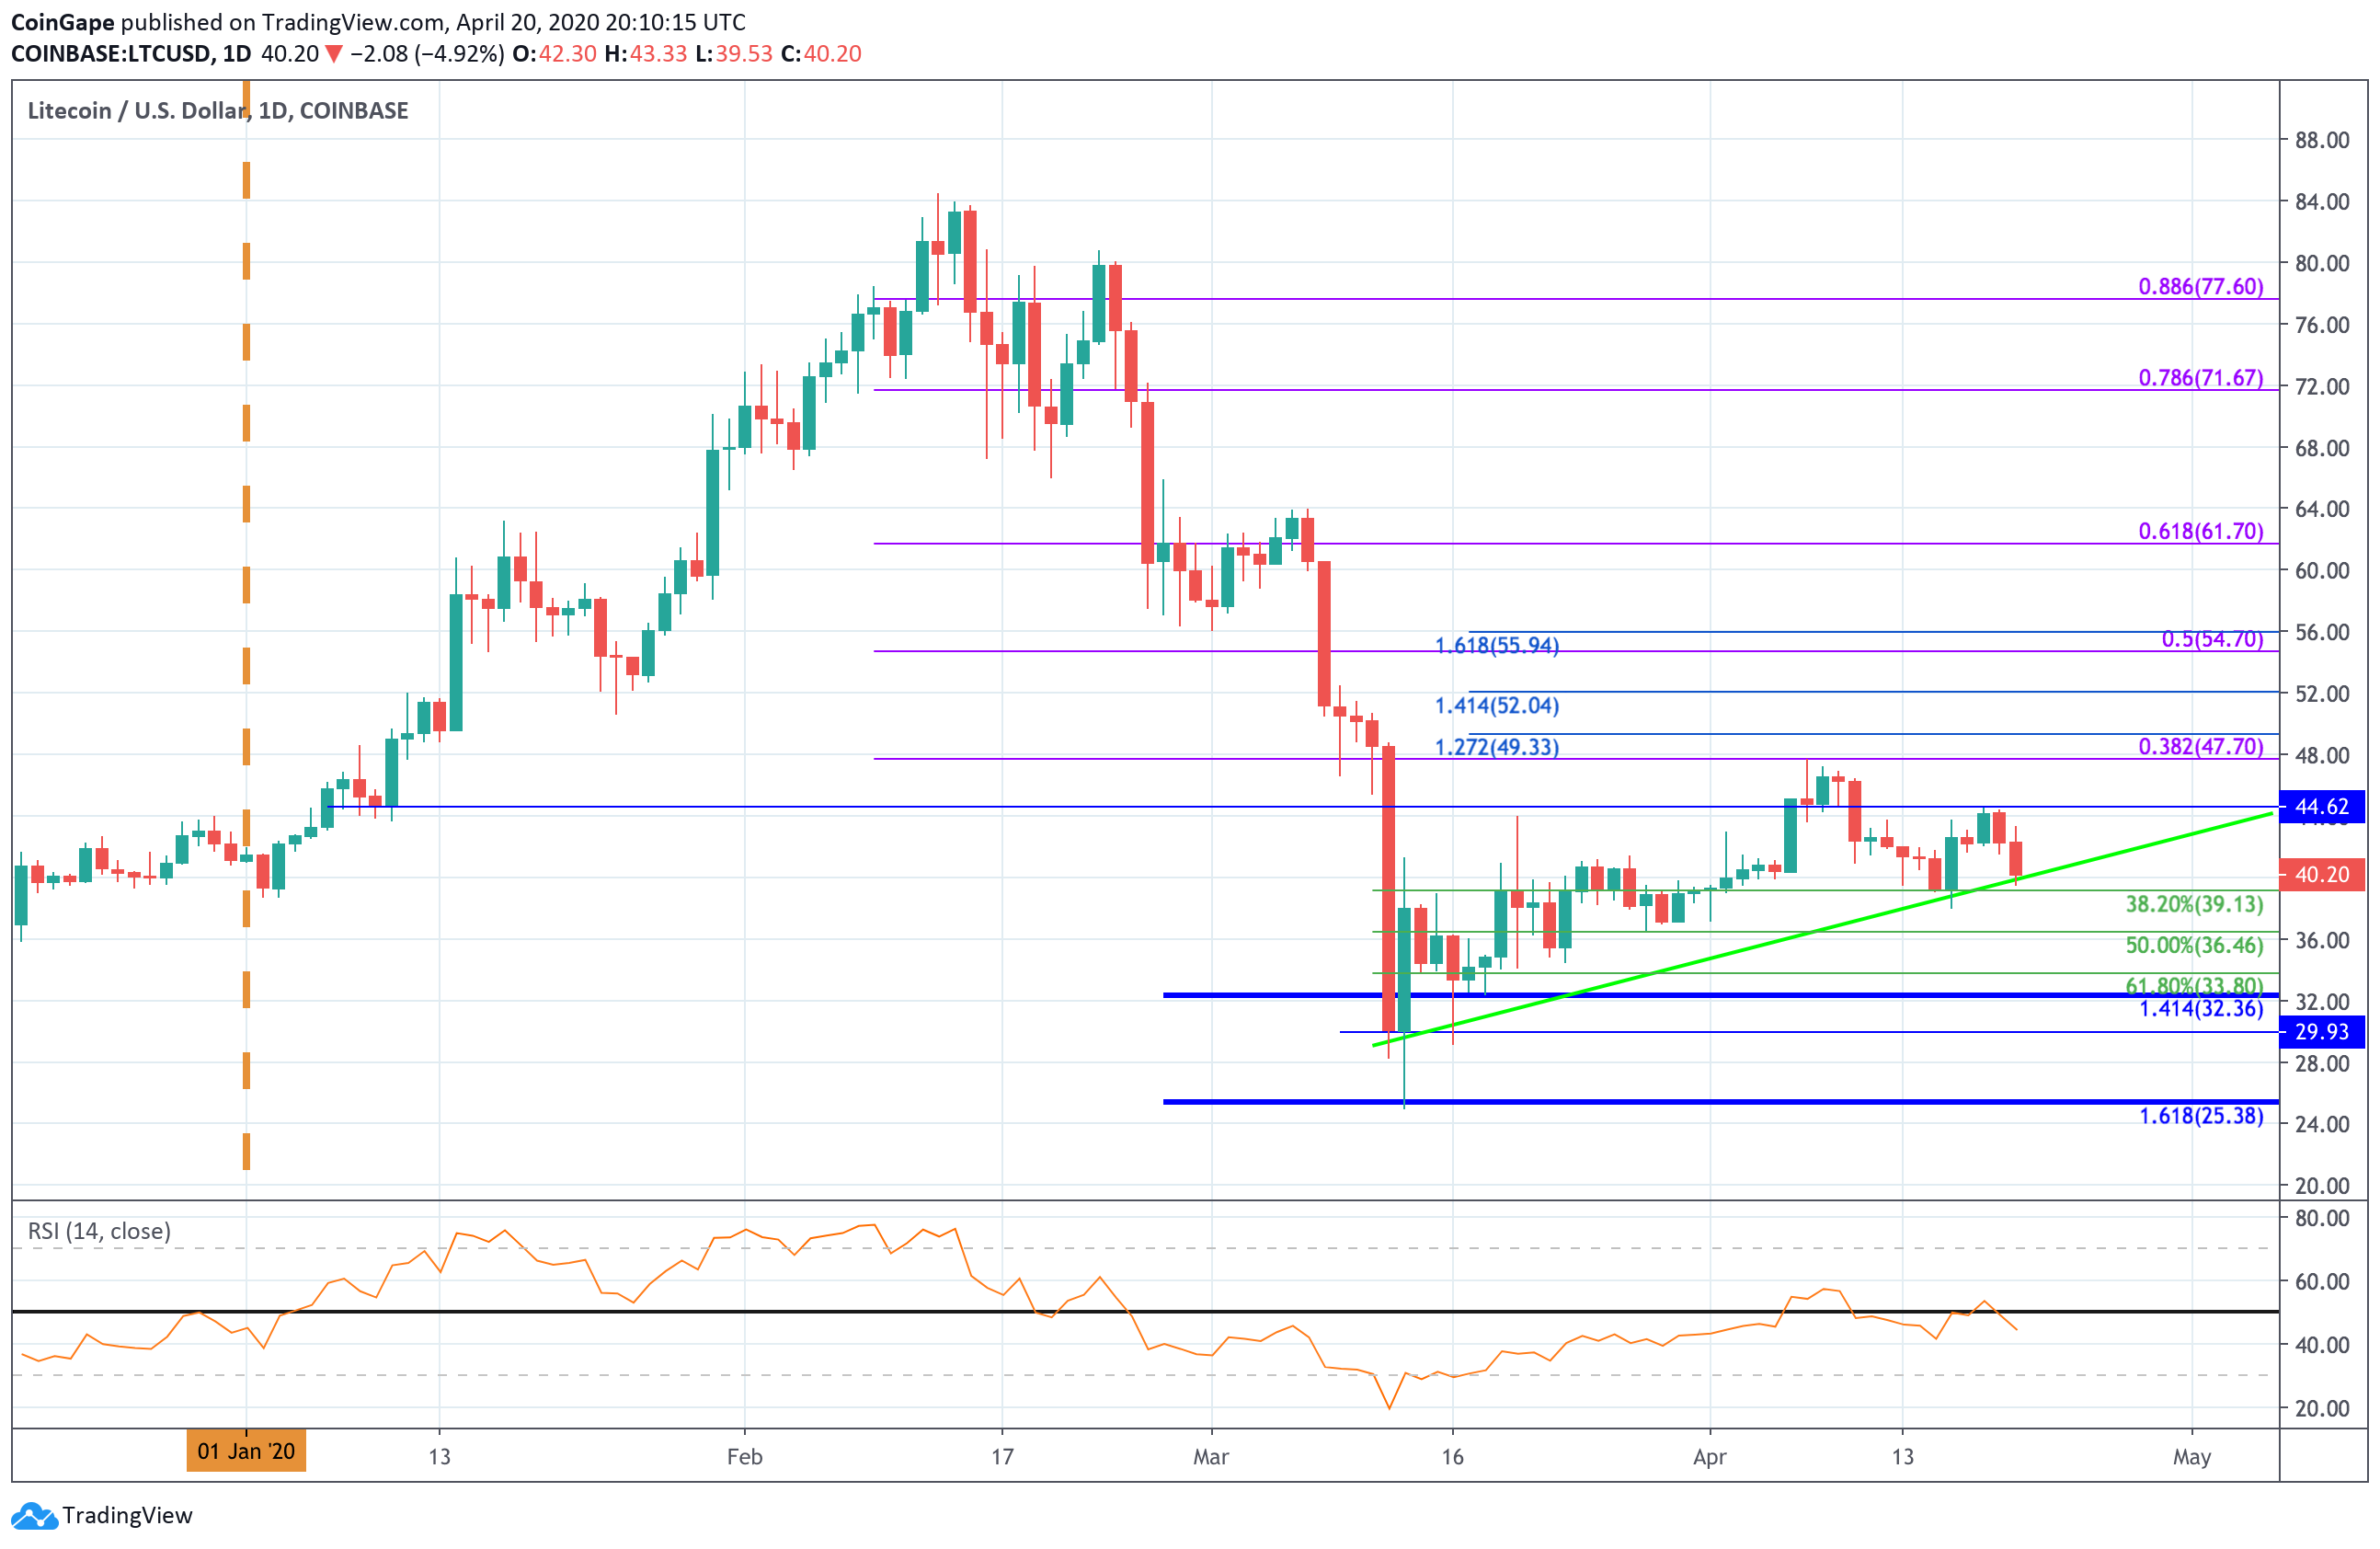
LTC/USD – Daily CHART – SHORT TERM
Market Overview
Taking a look at the daily chart above, we can clearly see that Litecoin had reached a high in early April of $47.70 which was provided by a bearish .382 Fib Retracement. It was unable to overcome this level and this caused the market to roll over and fall into support at $39 – provided by a short term .382 Fib Retracement.
From here, we can see that Litecoin rebounded but was unable to overcome the resistance at $44.62 this weekend which caused the market to drop back into the support at the rising trend line.
Short term prediction: Neutral/Bearish
Litecoin is considered neutral but a break beneath $39 would turn it bearish.
If the sellers manage to push beneath the support at the rising trend line, the first level of support lies at $39.13 (.382 Fib Retracement). Beneath this, support lies at $36.46 (.5 Fib Retracement), and $33.80 (.618 Fib Retracement).
On the other side, the first level of strong resistance lies at $44.62. Above this, resistance lies at $47.70.
The RSI has also now broken beneath the 50 level which is a strong signal that the sellers are taking control of the market momentum.
Key Levels
Support:$42, $40, $39, $36, $35, $32, $30, $28, $25.
Resistance: $47.70, $49.33, $50, $52, $54.70, $56.
Play 10,000+ Casino Games at BC Game with Ease
- Instant Deposits And Withdrawals
- Crypto Casino And Sports Betting
- Exclusive Bonuses And Rewards


Why Trust CoinGape
CoinGape has covered the cryptocurrency industry since 2017, aiming to provide informative insights Read more… to our readers. Our journal analysts bring years of experience in market analysis and blockchain technology to ensure factual accuracy and balanced reporting. By following our Editorial Policy, our writers verify every source, fact-check each story, rely on reputable sources, and attribute quotes and media correctly. We also follow a rigorous Review Methodology when evaluating exchanges and tools. From emerging blockchain projects and coin launches to industry events and technical developments, we cover all facets of the digital asset space with unwavering commitment to timely, relevant information.

Delivered every day.
- Insights that move markets
- 100,000 active subscribers
Related Articles


- Peter Brandt Flips Bullish, Predicts Bitcoin Rally As Price Holds Above $70k
- XRP News: Institutional Use Case Expands as Doppler Finance Integrates WXRP for Multi-Chain Access
- Trump Tariffs: Bitcoin Faces Fresh Headwinds as 15% Global Tariffs Begin This Week Amid Iran War
- Bitget Unveils ‘Crypto Anti-Bias Pledge’ To Support Women’s Inclusion In Crypto
- U.S.-Iran War: Crypto Market Rebounds as Iran Reportedly Reaches Out To U.S. To End Conflict
- Dogecoin Price Outlook as BTC Recovers Above $73,000
- XRP Price Prediction as Iran-U.S. Peace Talks Trigger a Crypto Rally
- COIN Stock Analysis as Bitcoin Retests $72k Ahead of February NFP Data
- Robinhood Stock Price Prediction As Cathie Wood Buys $12M Dip in Bold ARK Move
- Bitcoin Price At Risk? Professor Who Predicted US-Iran War Says America Could Lose
- Gold Price Prediction March 2026: Rally, Crash, or Record Highs?


