
$2000 or $1500; Where ETH Price is Heading this September?


In the last three weeks, the Ethereum sellers showed multiple attempts to break below the $1626 support level. The long-tail rejection projected in the daily chart reflects active accumulation from buyers at this dip. However, the prevailing correction phase is still intact, Will support recuperate the bullish momentum or lead to a long downfall?
Also Read: Ethereum Soars In Unique Addresses After SEC Hints At Ether ETF Approval
Support Trendline Carries the Ethereum Coin Relief Rally
- The crypto buyers witnessing high demand at $1626 support
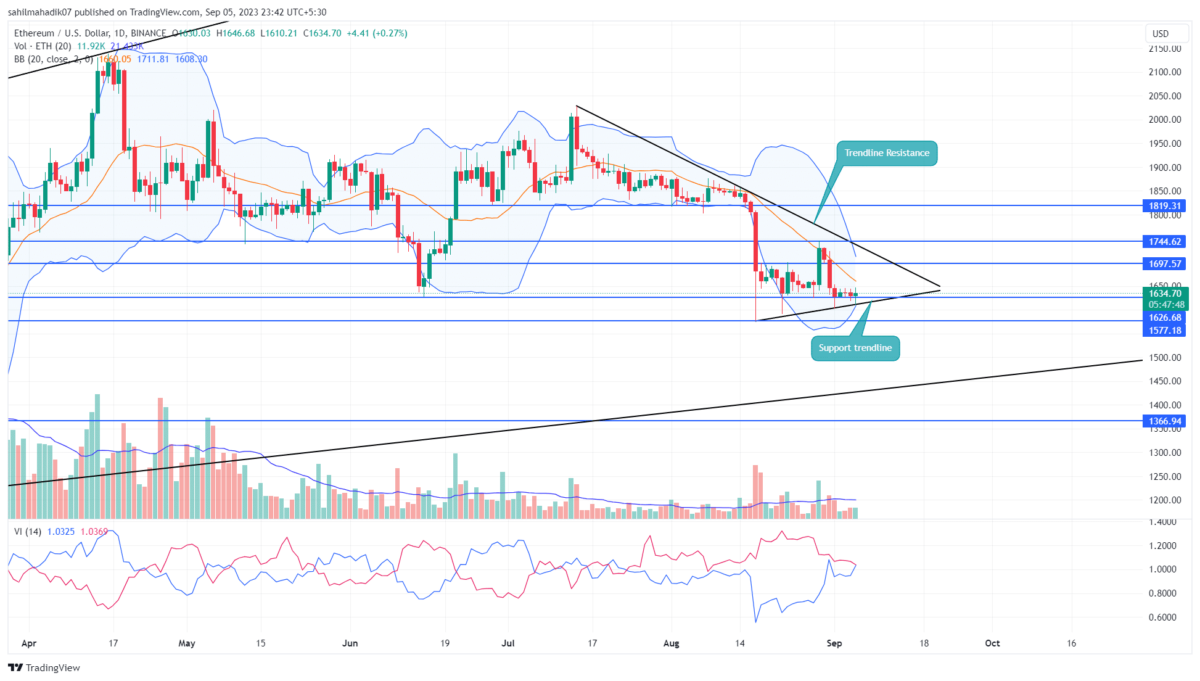
- A bullish breakout from the overhead trendline may bolster ETH price rally to $2020
- The intraday trading volume in Ether is $4.7 Billion, indicating a 26% gain.
 Source- Tradingview
While the Ethereum (ETH) coin has been battling market turbulence, the combined support of $1626 and an ascending trendline has consistently provided a safety net for buyers. Amid the last three weeks of uncertainty in the crypto market, the altcoin price has rebounded thrice from the support trendline preventing sellers from triggering a major correction.
During the most recent market downturn, Ethereum price attempted a rally but faced resistance at $1745, subsequently dropping by 8% to retest the aforementioned combined. Despite a failed recovery attempt, the buyers still defending the $1625 and lower trendline reflect its significance in shaping current market dynamics.
At the moment, the ETH price is trading around $1634. If buyers maintain their pressure and the support trendline continues to hold, we might see Ethereum surge by approximately 5-6%. This surge could challenge the prevailing descending trendline, which has been the backbone of the ongoing corrective phase. For a more pronounced recovery, it’s essential for buyers to break past this resistance.
[converter id=”eth-ethereum” url=”https://coingape.com/price/converter/eth-to-usd/?amount=1″]
Extended Correction May Push ETH Price to $1500
While Ethereum Coin benefits from its ascending trendline and the $1626 support, it is crucial to note that these relief rallies, by nature, aim to reset the dominant trend. If the Ethereum price were to close below these aforementioned supports, we could see a heightened selling pressure, potentially driving the price down first to $1577 and, if the decline persists, even to the $1500 mark.
- Vortex Indicator: A potential bullish crossover between VI+(blue) and VI-(orange) suggests that positive (upward) price movement is gaining strength
- Bollinger Band: The squeezed range of Bollinger Band indicators reflects increasing uncertainty sentiment.

Why Trust CoinGape
CoinGape has covered the cryptocurrency industry since 2017, aiming to provide informative insights Read more…to our readers. Our journal analysts bring years of experience in market analysis and blockchain technology to ensure factual accuracy and balanced reporting. By following our Editorial Policy, our writers verify every source, fact-check each story, rely on reputable sources, and attribute quotes and media correctly. We also follow a rigorous Review Methodology when evaluating exchanges and tools. From emerging blockchain projects and coin launches to industry events and technical developments, we cover all facets of the digital asset space with unwavering commitment to timely, relevant information.
24 Hours volume
$13.43B
Market Cap
$261.49B
Max Supply
NA


