Binance Coin Price Prediction as Bullish Pattern Amid Strategic Pause Sees 35% Surge


Binance Coin Price Prediction: The recent underperformance of Bitcoin, particularly in light of the anticipated launch of the Spot Bitcoin ETF, has sparked a wave of selling across the altcoin market. This downturn has affected a wide array of major cryptocurrencies, including Binance Coin (BNB), the native token of the world’s largest cryptocurrency exchange. Despite a relatively moderate pullback compared to other altcoins, Binance Coin has experienced a 6.5% decline from its previous high of $338, now trading around $316.
Will Post-Correction Rally Push Binance Coin to $400?
- A healthy retracement accentuates the BNB price uptrend intact.
- A bullish breakout from the flag pattern will trigger a directional rally.
- The intraday trading volume in the BNB coin is $1.59 Billion, indicating a 113% gain

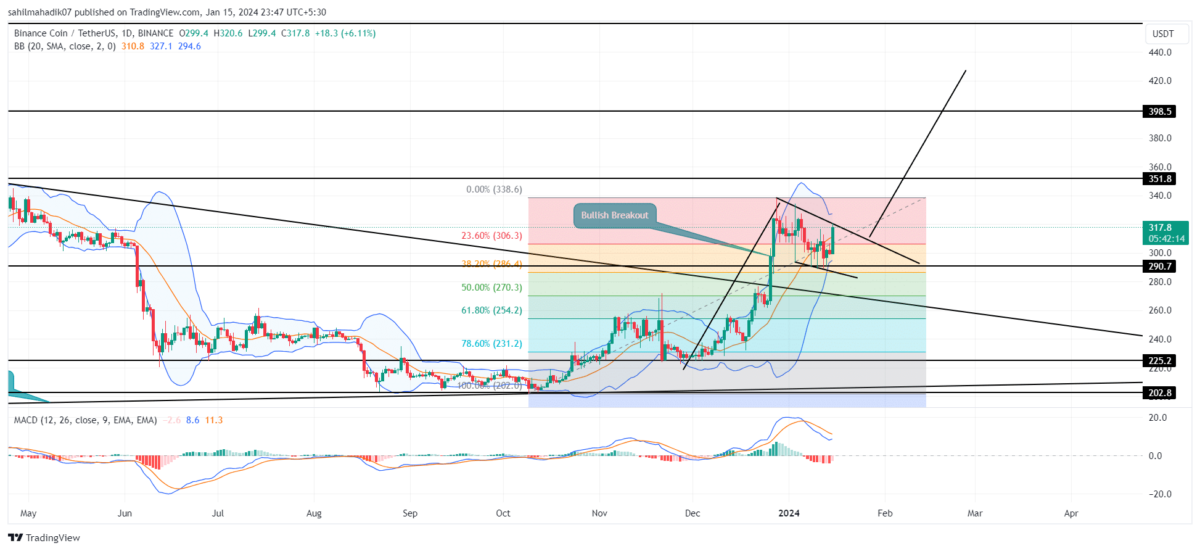
This current market correction reflects a sense of uncertainty among investors. However, a closer examination of BNB’s daily time chart reveals that the correction is occurring within a bullish flag pattern, bounded by two parallel trend lines.
This suggests that the current movement of Binance Coin price is a natural consolidation phase following a rally, providing a necessary pause for buyers. Moreover, the declining price trading above the 50% Fibonacci retracement level indicates the prevailing bullish trend intact.
At the time of writing, Binance Coin is trading at $370, showing a 6% increase and hinting at a potential bullish breakout from the flag pattern. If the daily candle closes above the upper trendline, it could serve as a robust foundation for Binance Coin to continue its recovery.
Should this breakout occur, the price of BNB may aim for successive targets of $360 and $420, representing a potential growth of 35-38%.
BNB vs BTC Performance

Over the last quarter, both Binance coin and Bitcoin have demonstrated a positive trajectory. However, the current market uncertainty, especially those revolving around the Spot Bitcoin ETF, has somewhat hindered the growth momentum of BNB price, as seen in its formation of lower highs. Meanwhile, the Bitcoin price has been charting a more steady upward course, consistently setting new, higher highs and lows. This contrast underscores the underperformance of the Binance coin with the broader market sentiment.
- Bollinger Band: The narrow range of the Bollinger Band indicator accentuates the market sentiment is highly volatile.
- Moving average convergence divergence: A potential bullish crossover between MACD and the signal line will give an early signal for flag breakout.
Related Articles:
- Binance Dethroned As Indian Traders Flock To Local Firms Amid Regulatory Scrutiny
- Binance Adds Manta Network As Manta Pacific’s TVL Surpass $800 Mln
- Bitcoin (BTC) Price to Touch $1M in Days to Weeks – Samson Mow

Why Trust CoinGape
CoinGape has covered the cryptocurrency industry since 2017, aiming to provide informative insights Read more…to our readers. Our journal analysts bring years of experience in market analysis and blockchain technology to ensure factual accuracy and balanced reporting. By following our Editorial Policy, our writers verify every source, fact-check each story, rely on reputable sources, and attribute quotes and media correctly. We also follow a rigorous Review Methodology when evaluating exchanges and tools. From emerging blockchain projects and coin launches to industry events and technical developments, we cover all facets of the digital asset space with unwavering commitment to timely, relevant information.

Related Articles


- Michael Saylor Says Quantum Risk To Bitcoin Is a Decade Away, Describes it as ‘FUD’
- White House Proposes Stablecoin Rewards Compromise as CLARITY Act Odds Drop to 44%
- Trump’s Board Of Peace Eyes Dollar-Backed Stablecoin For Gaza Rebuild
- Trump’s World Liberty Financial Flags ‘Coordinated Attack’ as USD1 Stablecoin Briefly Depegs
- Trump Tariffs: U.S. Threatens Higher Tariffs After Supreme Court Ruling, BTC Price Falls
- COIN Stock Risks Crashing to $100 as Odds of US Striking Iran Jump
- MSTR Stock Price Predictions As Michael Saylor’s Strategy Makes 100th BTC Purchase
- Top 3 Meme Coins Price Prediction As BTC Crashes Below $67k
- Top 4 Reasons Why Bitcoin Price Will Crash to $60k This Week
- COIN Stock Price Prediction: Will Coinbase Crash or Rally in Feb 2026?
- Shiba Inu Price Feb 2026: Will SHIB Rise Soon?


