Bitcoin, Ethereum Price Prediction- Market Leaders Retest Local Support; Buy Again?


Bitcoin, Ethereum price prediction: the BTC and ETH prices continue to drop lower, revisiting the weekly support. The lower price rejection candles showed in both these coin’s charts indicate the prices witnessed a minor relief rally. . At 7:58 am EST Monday, the global crypto market dropped to a low of $797.66 billion, losing 2.91% in the past 24 hours.
However, the total crypto market volume has grown 51.9% to $61.34 Billion. Currently, the total volume in DeFi stands at $4.67 Billion, which makes up 7.62% of the total crypto market 24-hour volume.
Top Gainers and Losers
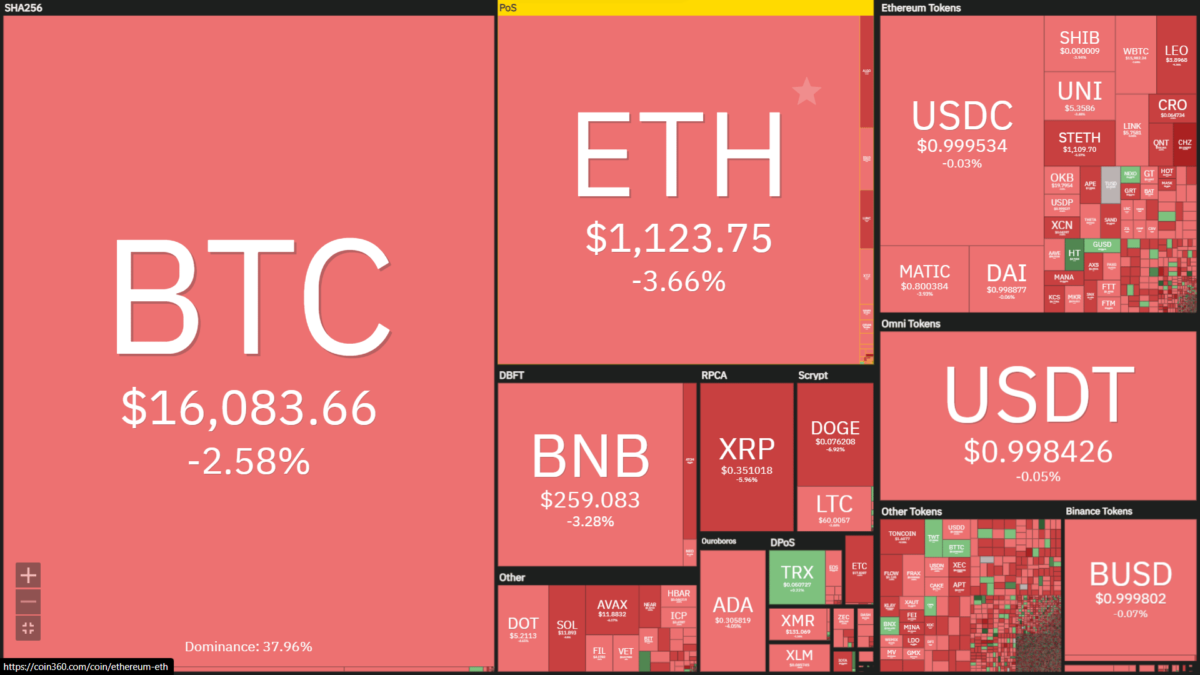 Source- Coin360
While most cryptocurrencies are trading in red today, a few of the top 100 listed coins display green candles. Thus, as the press time, Huobi Token (HT) at $4.81 has recorded the highest gain of 13.75% in the last 24 hours, followed by NEM (XEM) at $0.03438, gaining 7.34%. Meanwhile, Chiliz and Algorand are the top losers, where the CHZ at $0.1929 shows a 16.00% fall, while the ALGO price at $0.246 shows a 12.28% fall.
Bitcoin Price
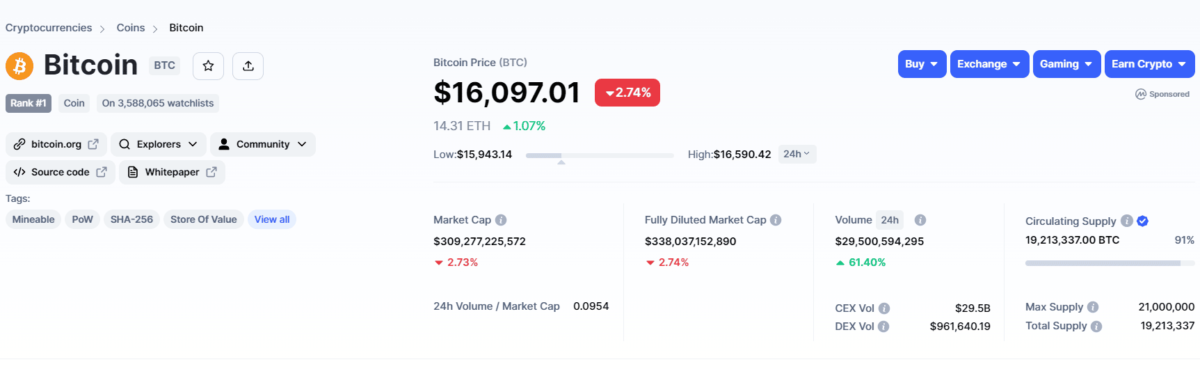 Source- Coinmarketcap
The Bitcoin price has remained sideways for nearly two weeks now. Amid this consolidation, the price has thrice retested the $16000 psychological support. Furthermore, with an intraday loss of 1.19%, the coin price currently trades at $16082 and tries to sustain above the mentioned support.
However, the several long-tail rejection candles at $16000 suggest a possible bullish reversal. However, a possible relief rally must surpass the overhead resistance to obtain sustained recovery.
 Source- Tradingview
Nonetheless, if the sellers’ pressure persists, the sellers may break the bottom support of $16000 to prolong the prevailing downtrend. A daily candle closing below $16000 will drive the BTC price $6.7% down to hit $14800.
Ethereum price
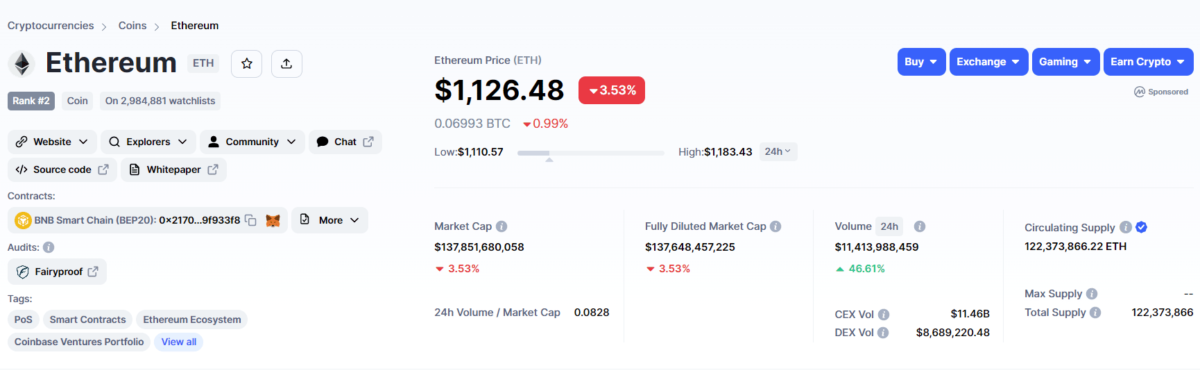 Source- Coinmarketcap
On November 20th, the Ethereum coin price gave a high momentum breakdown from the $1190 neckline support of descending triangle pattern. Thus, the post-retest rally plunges the price by 5.56% down to its current price of $1126.
However, the 4-hour chart shows a long lower-price rejection candle at this local support indicating the buyers continue to defend this level. Thus, a potential bullish reversal may push the prices 6% higher, but the pattern’s resistance trendline could restrict further growth.
 Source-Tradingview
If the selling pressure persists in the crypto market, a breakdown below $1100 will encourage a downfall to $1000 psychological support.

Why Trust CoinGape
CoinGape has covered the cryptocurrency industry since 2017, aiming to provide informative insights Read more…to our readers. Our journal analysts bring years of experience in market analysis and blockchain technology to ensure factual accuracy and balanced reporting. By following our Editorial Policy, our writers verify every source, fact-check each story, rely on reputable sources, and attribute quotes and media correctly. We also follow a rigorous Review Methodology when evaluating exchanges and tools. From emerging blockchain projects and coin launches to industry events and technical developments, we cover all facets of the digital asset space with unwavering commitment to timely, relevant information.