 Buy $GGs
Bitcoin Price Analysis: Extended Consolidation Indicates Reversal; Time To Enter?


Bitcoin price analysis shows an extended consolidation with a modest bullish bias. The price has come under renewed selling pressure after the bearish formation near the swing high. BTC is mostly tilted toward the bullish side as the overall crypto space observes a mindful buying.
BTC Fear and Greed Index read at 23/100, indicating an extreme fear, which is a sign that retail investors are not really participating.
As of writing time, BTC/USD is trading at $21,582.56, up 0.97% for the day. The 24-hour trading volume of the largest cryptocurrency by the market cap is down 2.22% at $31.56 billion.
- Bitcoin price analysis implies a sideways movement with consolidation.
- A daily close above $21,900 would be a reversal to the higher side.
- The downside is capped near $20,900 on the daily chart.
Bitcoin price looking for a reversal signal
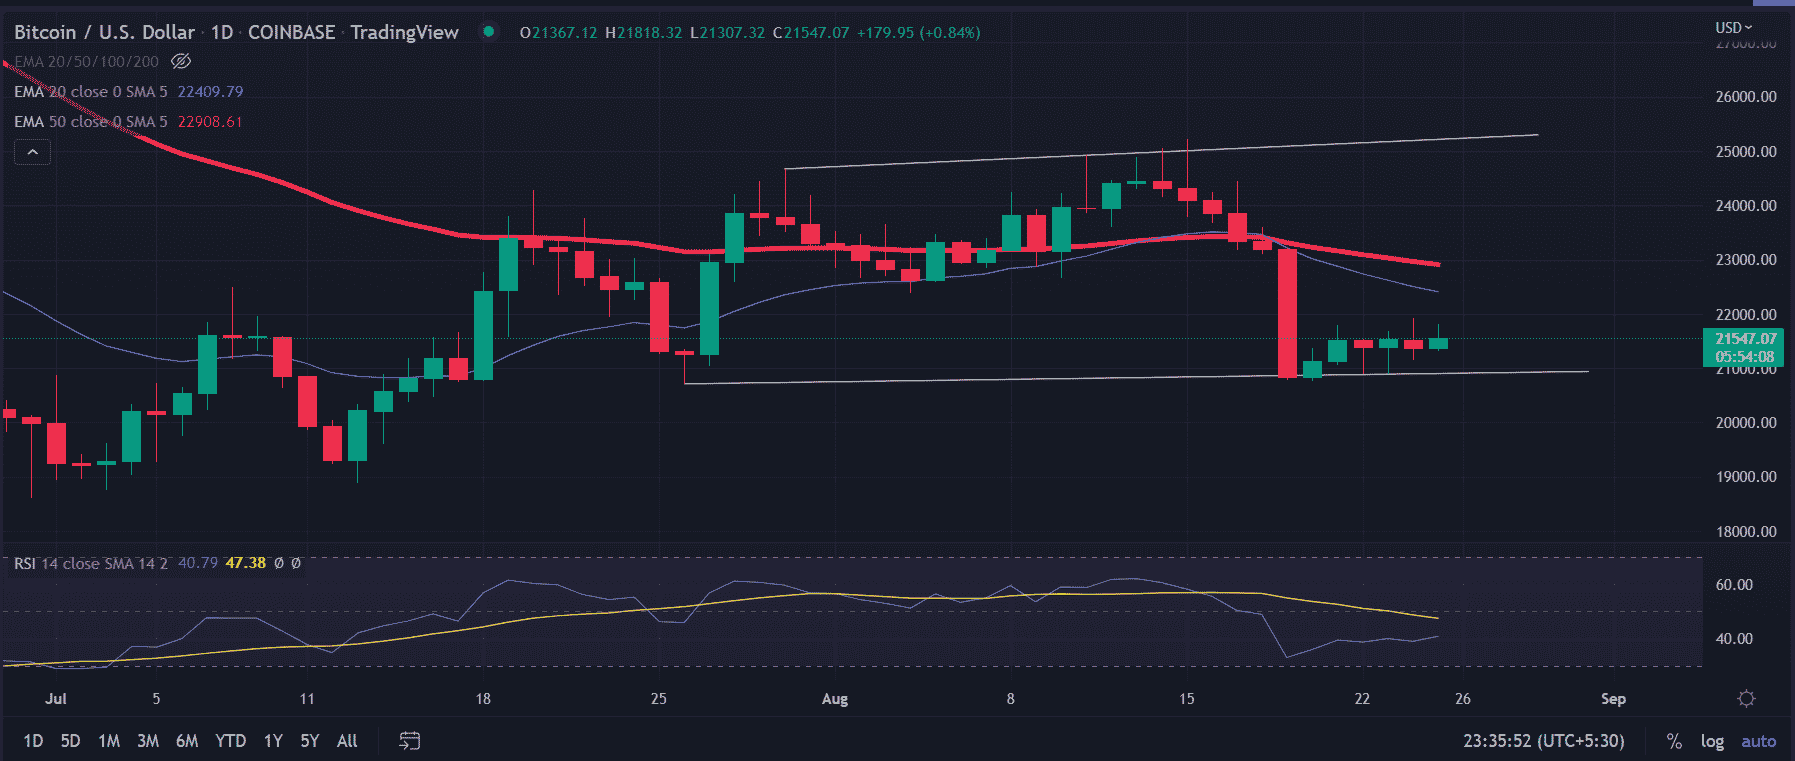
Bitcoin price trades at $21,558, a 45% high from the May 12 low of around $17,500. After consolidating a near lower level, the price started trading in an ascending channel on the daily chart.
An ascending channel is a bullish channel suggesting that BTC might continue to move upward if it continues to trade within the lower trend line of the channel. Hence, a successful attempt to hold the $20,900 level provided by the broadening channel could see the price to test the 20d-day exponential moving average at $22,400. If the bulls managed to tag the mentioned level, we could see $23,000 next.
On the flip side, a daily close below $21,300 could wash out any hope for the bulls. Once the level is broken, the bears could target $20,900.
Earlier, the formation of ‘Evening star’ on August 13, resulted in a depreciation of 35% from the swing high of $25,214.57. Further, the selling is intensified below the critical 20-day and 50-day EMA crossover.
The RSI (14) attempted to move above the midline from the oversold zone, indicating a probable upside in the price.
1-hour chart depicts positive momentum

On the hourly time frame, BTC is taking support near the bullish trend line that extends from the low of $20,900. The price tested this ascending line multiple times and made new highs every time.
The same pattern is happening in the current market structure. Still, the price is struggling below the 20-day EMA, indicating a challenge for the bulls.
Also read: https://Ignore The FUD, This Historic Bitcoin Indicator Is Extremely Bullish
An hourly close above $21,800 would pave the way for further gains. BTC buyers would seek $22,400 in this upside run. A buy-on dip is the best course of action at this time.
Play 10,000+ Casino Games at BC Game with Ease
- Instant Deposits And Withdrawals
- Crypto Casino And Sports Betting
- Exclusive Bonuses And Rewards


Why Trust CoinGape
CoinGape has covered the cryptocurrency industry since 2017, aiming to provide informative insights Read more…to our readers. Our journal analysts bring years of experience in market analysis and blockchain technology to ensure factual accuracy and balanced reporting. By following our Editorial Policy, our writers verify every source, fact-check each story, rely on reputable sources, and attribute quotes and media correctly. We also follow a rigorous Review Methodology when evaluating exchanges and tools. From emerging blockchain projects and coin launches to industry events and technical developments, we cover all facets of the digital asset space with unwavering commitment to timely, relevant information.

Related Articles


- Indiana Signs Bitcoin Bill Into Law Allowing Crypto in Retirement Plans
- ‘Time to Act Is Now’: CFTC Chief Pushes Swift Passage of CLARITY Act
- Trump Tells Congress to Pass Crypto Market Bill ‘ASAP,’ Blasts Banks for Stalling
- BTC Price Bounces as Spot Investors Buy The Dip Amid Iran War Jitters
- CFTC Chief Mike Selig Signals US Crypto Perpetual Futures Rollout in Coming Weeks
- Gold Price Prediction March 2026: Rally, Crash, or Record Highs?
- RIOT Stock Prediction as Needham, Piper Sandler Slash Target After Earnings
- Cardano Price Outlook As Charles Hoskinson Warns Over CLARITY Act
- Circle Stock Price Climbs 15% to $96, Can Rally Continue in March 2026?
- Bitcoin Price Prediction as US-Iran War Enters 4th Consecutive Day
- Top 5 Historical Reasons Dogecoin Price Is Not Rising


