
Bitcoin Price May Revisit Its $18800 Accumulation Zone; Buy Again?


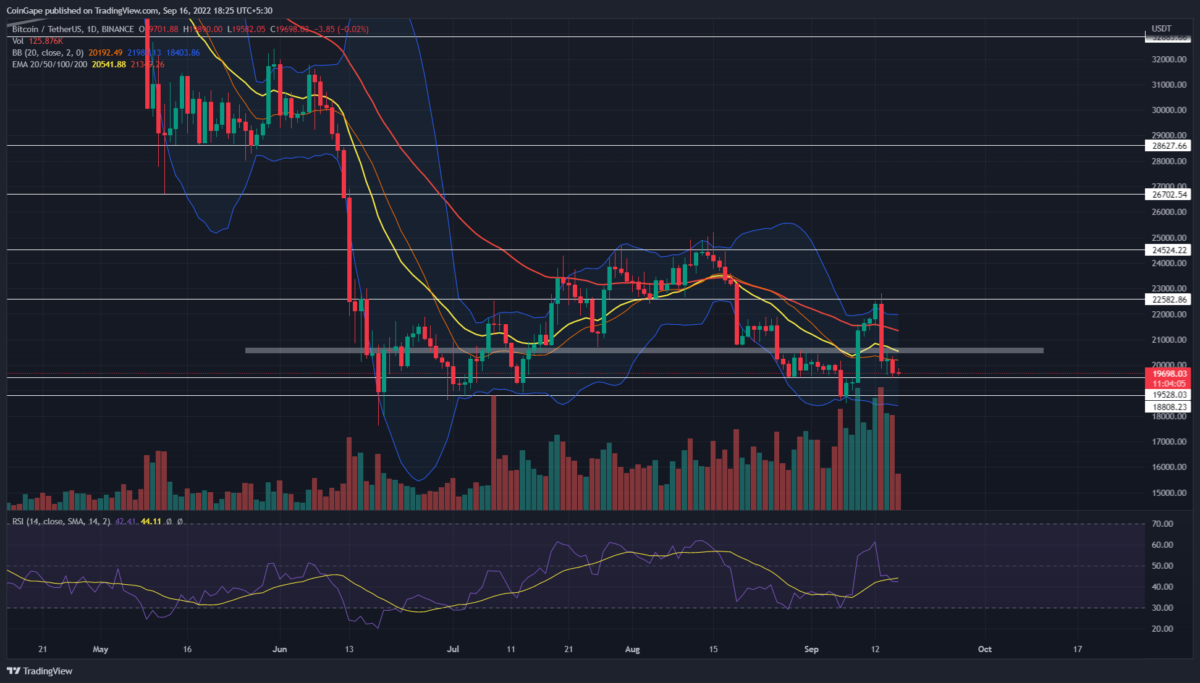
The Bitcoin daily technical chart accentuates an ongoing sideways rally. The $24500 resistance has acted as a growth limiter, registering the price action to reach higher levels. On the flip side, the $18800 provides bottom support for the range-bound rally. The Bitcoin price currently shows a reversal sign at the nearest support of $19500, and thus, the coin traders can witness a minor pullback before the prices continue their downfall.
Key points:
- The $19500 support bolstered a 5% relief rally before the resumption of the prevailing downfall.
- The coin holder lost 20-and-50-day EMA support with the recent price drop
- The intraday trading volume in Bitcoin is $30.1 Billion, indicating a 22% loss
Source-Tradingview
The last bounce back from the $18800 support surged the Bitcoin price $20.2% higher to hit the $22600 barrier. However, the recent news of high CPI data caused a sharp sell-off in the crypto market on September 13th and tumbled the coin price by 9.5%.
The bearish engulfing candle breached the $20600, 20-and-50-day EMA altogether. Thus, the accelerated bearish momentum plummeted another 5% to reach minor support of $19500.
Also read: Here’s When Bitcoin (BTC) Price May Reclaim The 200-WMA Again
A low-volume Doji candle at this support indicates market participants’ uncertainty. This $19500 mark may likely bolster a minor bullish pullback to retest the $20600 mark as potential resistance.
If the selling pressure persists, the bitcoin price will continue its downfall to the $18800 accumulation zone.
Technical indicator
Bollinger band indicator: with the $20600 breakdown, the coin holders lost this indicator’s midline, which indicates that sellers have trend control.
Relative strength index: the daily RSI slope nosedived below the mean line, and 20-SMA indicates a negative sentiment building up. However, concerning the price retest to $18800, bottom support and the daily and weekly RSI slope shows a significant divergence.
This divergence reflects a strong possibility of Bitcoin rebounding from $18800 support.
Bitcoin Price Intraday Levels
- Spot rate: $19663
- Trend: Bearish
- Volatility: Low
- Resistance level- $22550 and $25000
- Support level- $20800 and $18830
Play 10,000+ Casino Games at BC Game with Ease
- Instant Deposits And Withdrawals
- Crypto Casino And Sports Betting
- Exclusive Bonuses And Rewards


Why Trust CoinGape
CoinGape has covered the cryptocurrency industry since 2017, aiming to provide informative insights Read more…to our readers. Our journal analysts bring years of experience in market analysis and blockchain technology to ensure factual accuracy and balanced reporting. By following our Editorial Policy, our writers verify every source, fact-check each story, rely on reputable sources, and attribute quotes and media correctly. We also follow a rigorous Review Methodology when evaluating exchanges and tools. From emerging blockchain projects and coin launches to industry events and technical developments, we cover all facets of the digital asset space with unwavering commitment to timely, relevant information.


- Jerome Powell Says No Rate Cuts Until Inflation Shows Progress, Bitcoin Crashes
- Crypto Market Eyes Fresh Liquidity as FTX Set To Distribute $2.2B To Customers
- FOMC Meeting: Fed Holds Rates Steady as Iran War Fuels Inflation Concerns
- CLARITY Act Markup Could Hold In April as Senate Eyes Year-End Passage, Senator Lummis Says
- Playnance’s GCOIN Goes Live On MEXC as Crypto Firm Targets Global Expansion
- Gold Price Crashed After U.S. Core PPI Came In Higher Than Expected.
- XRP Price Prediction 2026 Ahead of Major XRPL Technical Upgrades
- Will CRCL Stock Rally To $150 This Week After Clear Street Upgrade?
- Will Dogecoin Price Break $0.15 Before March End 2026?
- Bitcoin Price Forecast: Will BTC Break $80k Ahead of Fed Decision Today?
- MSTR Stock Prediction as Strategy Makes Largest Bitcoin Purchase in 2026 and Analyst Targets BTC Price $100K


