BTC Price Prediction: Bullish Pattern in Play Hints 8.5% Jump Ahead


At the August end, the Bitcoin price witnessed a momentary surge of 10%, trying to restore recovery sentiment in the market. However, the momentum was short-lived as the price quickly retreated to the local support at $25500, extending its consolidation phase. Is this support enough to trigger a fresh recovery rally?
Also Read: BTC Price Short-Term Holders Capitulation Persists, 26% Drop On The Cards?
Bullish Chart Pattern Foretells Potential Upswing
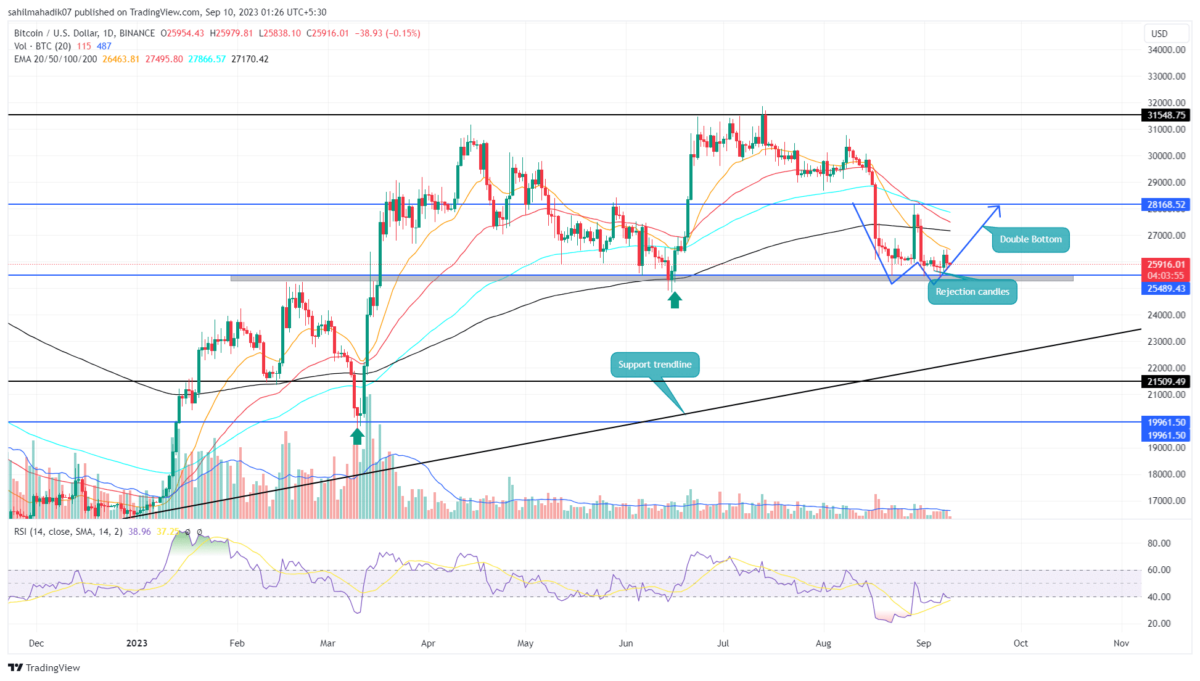
- The technical chart projects the demand pressure at $25000 is active.
- A bullish breakout from the $28168 barrier will surge the coin price by 8.5%
- The intraday trading volume in Bitcoin is $5.9 Billion, indicating a 56.5% loss.
 Source-Tradingview
The daily time frame chart reflects multiple lower price rejection candles at $25500 support, indicating the buyers continue to defend this level.
Concerning this support, the technical chart suggests the possibility of a double-bottom formation. This chart setup is often spotted at the bottom of a downtrend, projecting an increase in demand pressure for a bullish reversal.
By the press time, the BTC price traded at $259006, with an intraday loss of 0.19%.
If the current pattern follows through, the buyers would likely break past the $28,168 neckline resistance. This breakout would be a better signal of a bullish recovery and may push the prices to $31,548.
[converter id=”btc-bitcoin” url=”https://coingape.com/price/converter/btc-to-usd/”]
Will BTC Price Lose $25500 support?
It’s also worth noting that despite experiencing multiple rejections at the $25,489 support, the buyers failed to establish a significant rebound. This reflects weakness in bullish momentum and the possibility of $25000. This breakdown will invalidate the aforementioned pattern and push the prices to the $24000 mark
- Exponential Moving Average: A possible death crossover between 50-and-200 EMA would encourage sellers for prolonged consolidation.
- Relative Strength Index: Considering the same price bottom at $25500, the daily RSI slope a significant rally indicating the rising accumulation from traders.

Why Trust CoinGape
CoinGape has covered the cryptocurrency industry since 2017, aiming to provide informative insights Read more…to our readers. Our journal analysts bring years of experience in market analysis and blockchain technology to ensure factual accuracy and balanced reporting. By following our Editorial Policy, our writers verify every source, fact-check each story, rely on reputable sources, and attribute quotes and media correctly. We also follow a rigorous Review Methodology when evaluating exchanges and tools. From emerging blockchain projects and coin launches to industry events and technical developments, we cover all facets of the digital asset space with unwavering commitment to timely, relevant information.

Related Articles


- Michael Saylor Says Quantum Risk To Bitcoin Is a Decade Away, Describes it as ‘FUD’
- White House Proposes Stablecoin Rewards Compromise as CLARITY Act Odds Drop to 44%
- Trump’s Board Of Peace Eyes Dollar-Backed Stablecoin For Gaza Rebuild
- Trump’s World Liberty Financial Flags ‘Coordinated Attack’ as USD1 Stablecoin Briefly Depegs
- Trump Tariffs: U.S. Threatens Higher Tariffs After Supreme Court Ruling, BTC Price Falls
- COIN Stock Risks Crashing to $100 as Odds of US Striking Iran Jump
- MSTR Stock Price Predictions As Michael Saylor’s Strategy Makes 100th BTC Purchase
- Top 3 Meme Coins Price Prediction As BTC Crashes Below $67k
- Top 4 Reasons Why Bitcoin Price Will Crash to $60k This Week
- COIN Stock Price Prediction: Will Coinbase Crash or Rally in Feb 2026?
- Shiba Inu Price Feb 2026: Will SHIB Rise Soon?


