 Claim Card
ETH Price Prediction: Key Levels to Watch As Ethereum Coin Rebounds From $1600


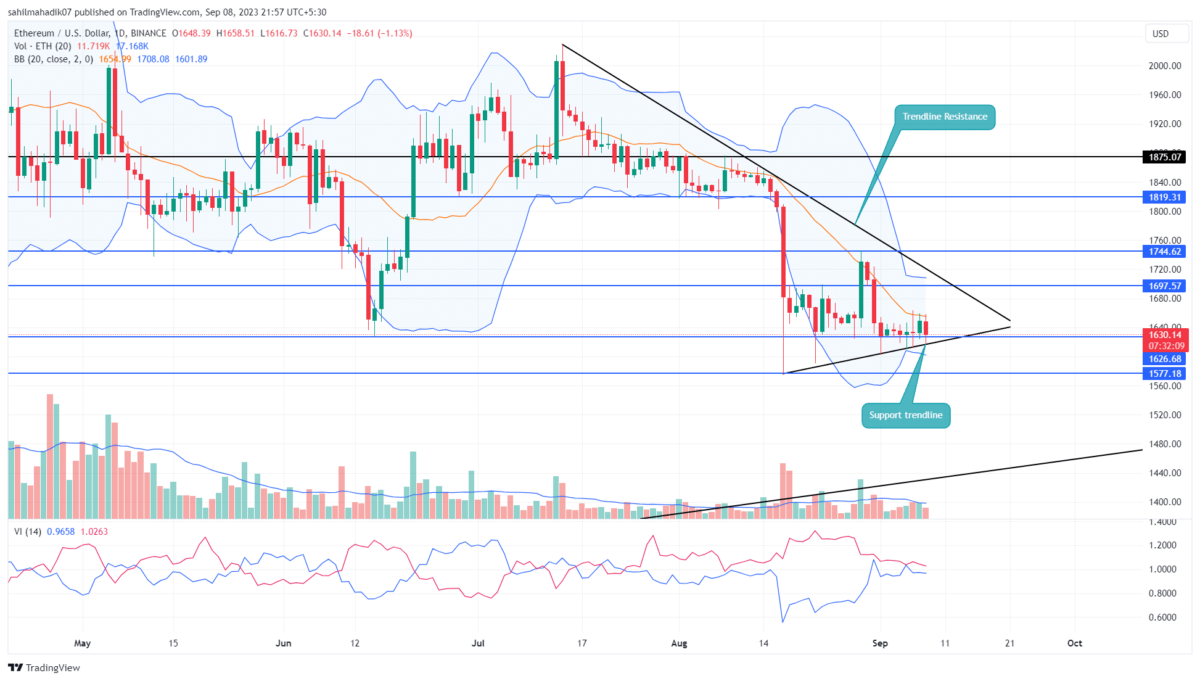
The ongoing price correction in Ethereum price has showcased a significant demand pressure around the $1600 mark. While falling prices were a concern, it has surprisingly turned sideways for the last 3 weeks, using the support of an ascending trendline. However, is this support enough to set a new recovery in ETH price?
Also Read: Ethereum Whales Added Over $400 Million In ETH, Will Price Action follow?
Support Trendline Bolsters Buyers for Bollinger
- A bearish breakdown from the support trendline will push the ETH price by 8% down.
- Lower price rejection around $1600 reflects rising buying pressure.
- The intraday trading volume in Ether is $5.6 Billion, indicating a 7.8% gain.
 Source- Tradingview
Diving into the daily time frame chart, it’s evident that the Ethereum price is being pulled in two directions by converging trend lines. On one hand, there’s a stubborn resistance trend line that has deflected the price downwards on two separate occasions. On the other, a trusty support trendline has come to buyers’ rescue multiple times, ensuring the coin doesn’t free-fall.
At the moment, the ETH price is trading at $1631. While there has been an intraday loss of 1%, it’s knocking on the door of the lower trendline once again. Interestingly, today’s daily candle shows signs of price rejection at the lower end.
This suggests that buyers are still in the game, possibly gearing up for another upward push. If this buying momentum continues, we could see a potential surge of about 4%, with Ether aiming for the upper trend line, approximately around $1680.
However, for a more concrete sign of a bullish recovery, it’s imperative for the coin to break past the aforementioned upper trendline.
[converter id=”eth-ethereum” url=”https://coingape.com/price/converter/eth-to-usd/?amount=1″]
Is ETH Price Heading to $1500?
The Ethereum price will remain sideways until the two above-mentioned trendlines are intact. Taking a pessimistic approach, if the ETH price ends up breaking below the lower trend line – and with a daily candle close beneath it – the market supply pressure will intensify. Such a move could pave the way for an extended correction phase and plunge the price to the $1,500 support level, marking a drop of around 8-10%.
- Vortex Indicator: A potential bullish crossover between the VI+(blue) and VI-(orange) will increase the buying pressure in the market
- Bollinger Band: The lower band of Bollinger band indicator aligned with the ascending trendline could offer additional support.

Why Trust CoinGape
CoinGape has covered the cryptocurrency industry since 2017, aiming to provide informative insights Read more…to our readers. Our journal analysts bring years of experience in market analysis and blockchain technology to ensure factual accuracy and balanced reporting. By following our Editorial Policy, our writers verify every source, fact-check each story, rely on reputable sources, and attribute quotes and media correctly. We also follow a rigorous Review Methodology when evaluating exchanges and tools. From emerging blockchain projects and coin launches to industry events and technical developments, we cover all facets of the digital asset space with unwavering commitment to timely, relevant information.

Related Articles


- Expert Predicts Deeper Bitcoin Decline as JPMorgan CEO Warns of Similarities to the 2008 Financial Crisis
- Trump Won’t Pardon FTX’s Sam Bankman-Fried (SBF), White House Says
- Third Spot SUI ETF Goes Live as 21Shares Fund Launches on Nasdaq
- Mark Zuckerberg’s Meta Reportedly Eyes Stablecoin Integration This Year Amid Regulatory Clarity
- Coinbase Rivals Robinhood As It Rolls Out Stocks, ETFs Trading In ‘Everything Exchange’ Push
- Cardano Price Signals Rebound as Whales Accumulate 819M ADA
- Sui Price Eyes Recovery as Third Spot SUI ETF Debuts on Nasdaq
- Pi Network Price Eyes a 30% Jump as Migrations Jumps to 16M
- Will Ethereum Price Dip to $1,500 as Vitalik Buterin Continues Selling ETH?
- XRP Price Outlook as Clarity Act Passage Odds Plunge to 53%
- COIN Stock Risks Crashing to $100 as Odds of US Striking Iran Jump


