 Buy $GGs
Ethereum Price Analysis: Bearish RSI Hints More Correction; Are You Holding?


Ethereum price analysis imprints a negative view for the day. The price sees a steady decline from the swing highs of $2,000 over the past four-session. It might be a much-anticipated correction or a trend reversal.
The current market structure favors the bearish sentiment. As of publication time, ETH/USD is exchanging hands at $1,830, down 2.46% for the day. The 24-hour trading volume rose more than 16% to $19.31 billion. A fall in price with a rise in volume is a bearish sign.
- Ethereum price extends the decline for the fourth consecutive session.
- The price took a shelter near the critical support zone of $1,850.
- A daily candlestick above $1,900 would favor the bulls.
Ethereum price consolidates
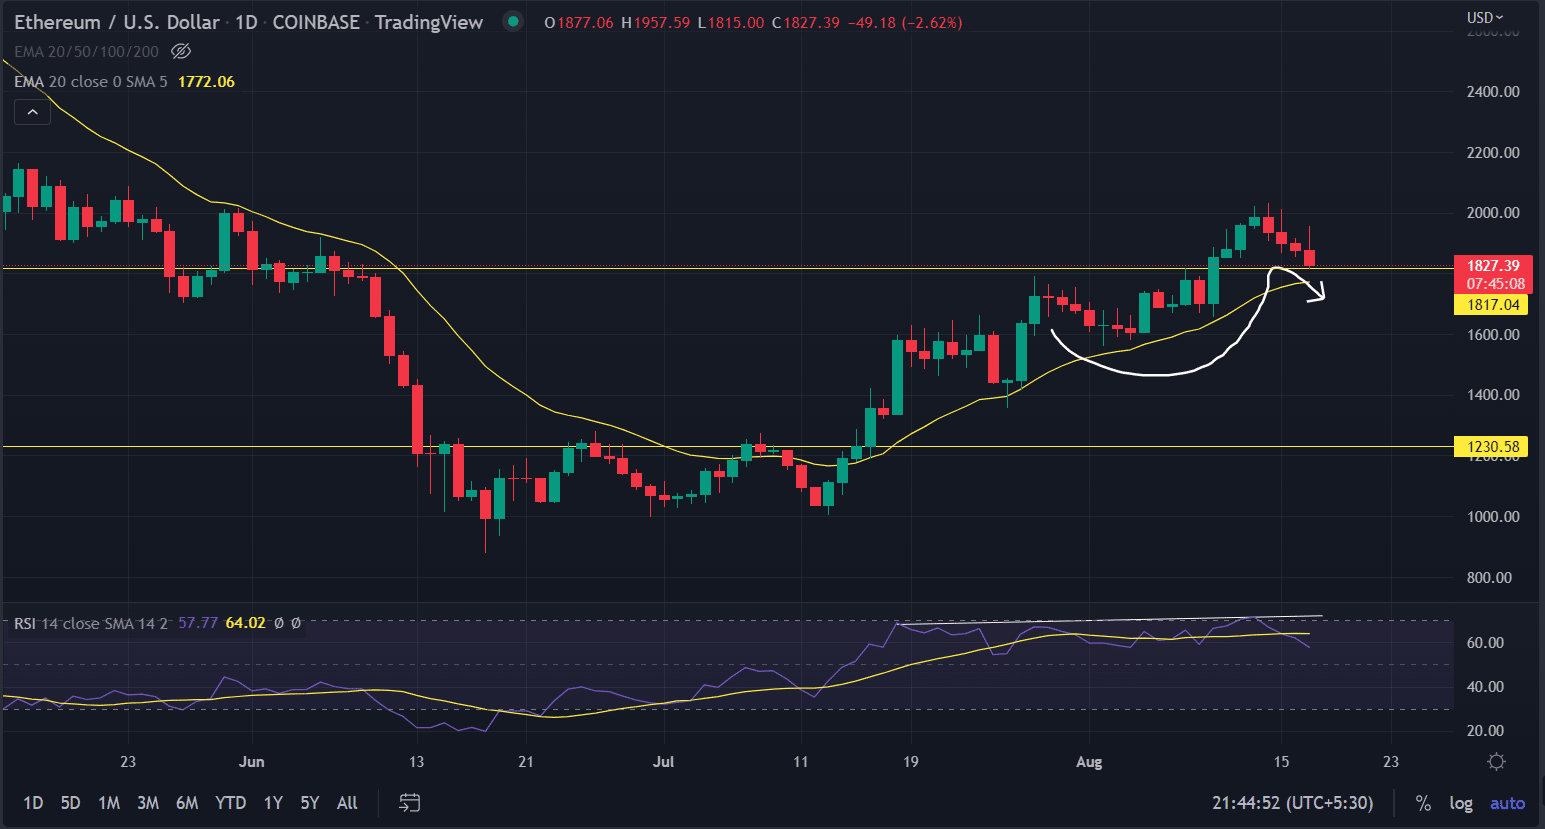
On the daily time scale, the Ethereum price analysis indicates a neutral to negative bias.
ETH gave a breakout of the” Cup & Handle” pattern on August 8 and started to move up from $1,730 to $2,030. The volumes are below the average line and declining, with the price moving upwards, which implies a cautious tone. When the market is rising while volume is declining, the big players missing from the market, more likely slowly exiting positions.
Over the last few sessions, we are seeing rejection candles near the higher level, breaking previous days’ low on the daily basis. If that continues to happen, we can expect a sharp big bearish candle in the coming days.
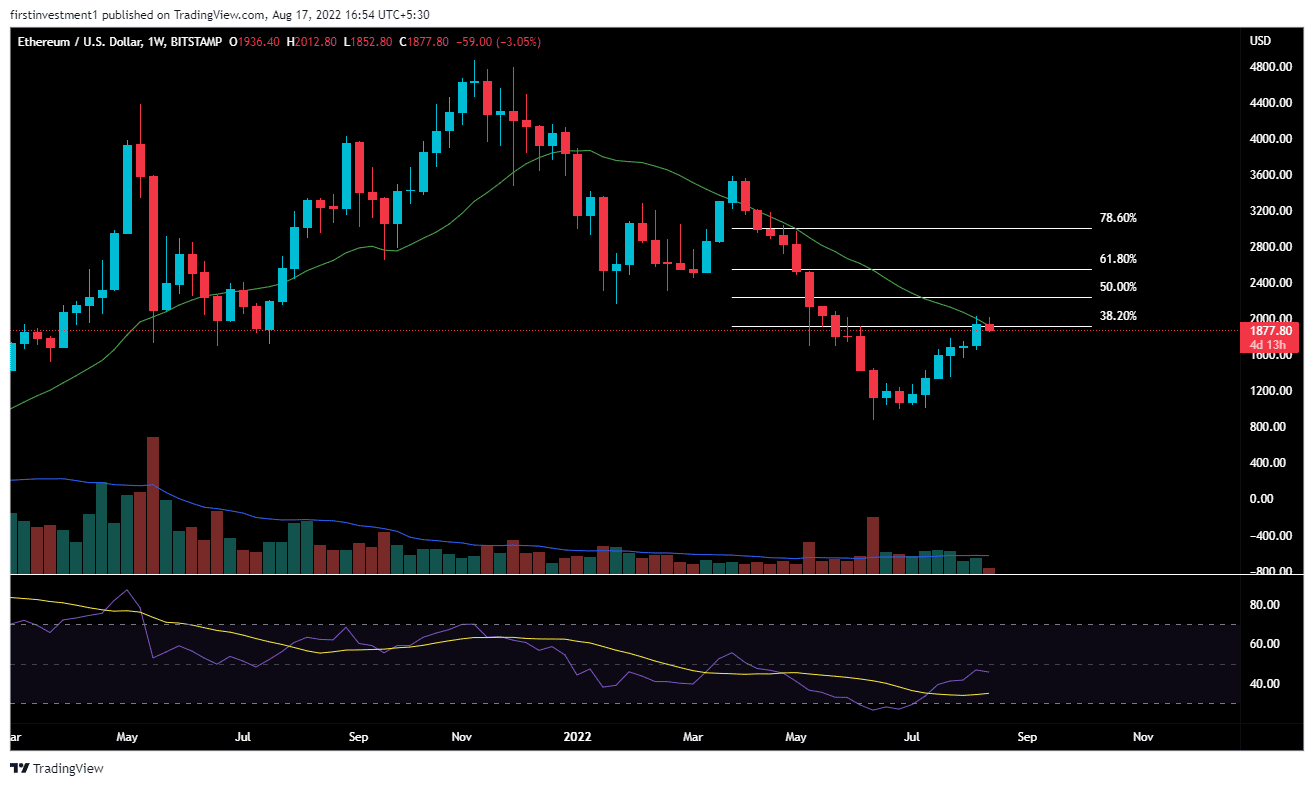
On the weekly charts, the price faces resistance at the 20-day Exponential Moving Average (EMA). Along with a 38.6% Fibonacci retracement, which will act as immediate resistance for this week.
If the price closes above recent highs of $2,032, then we can expect a good bullish momentum, otherwise, the market will slowly go down.
The nearest support for ETH could be found in the $1720 to $1750 zone. This is also a 20-Day EMA support level on the daily chart.
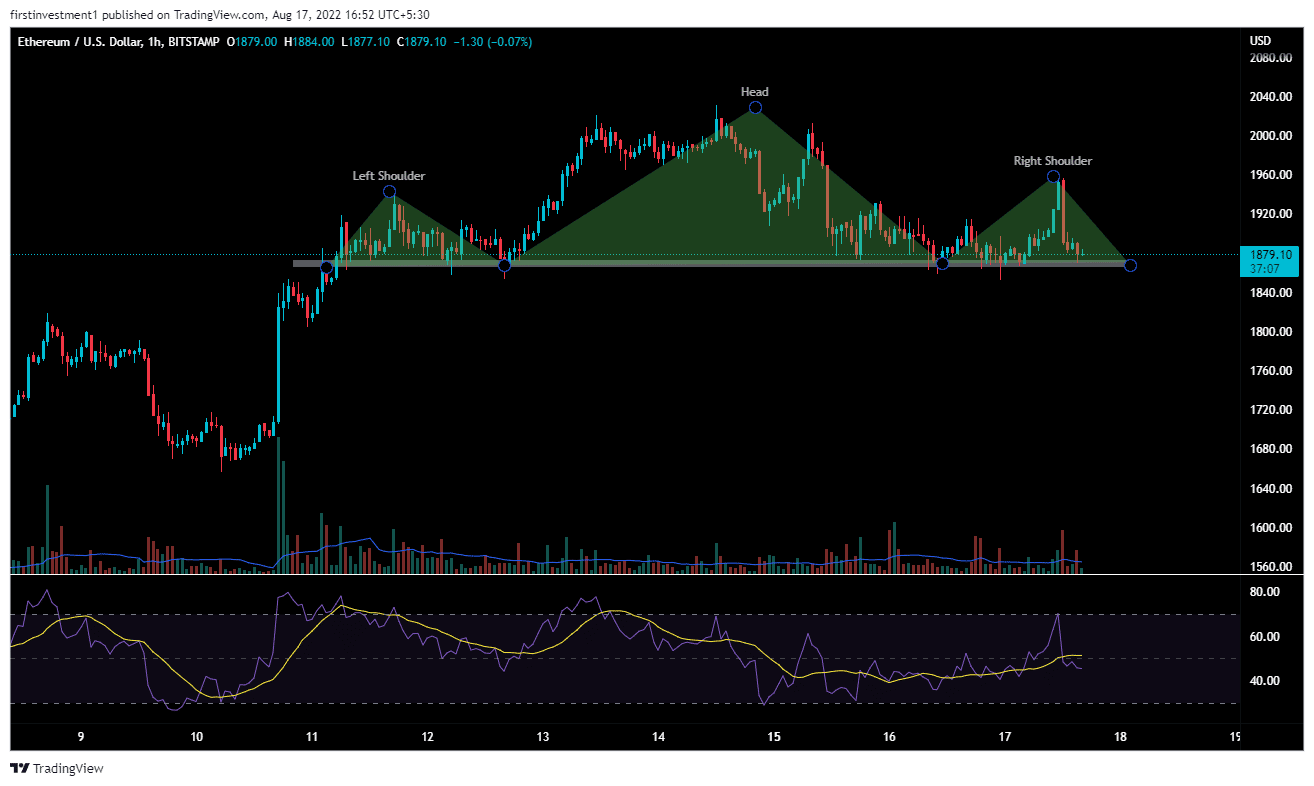
ETH on one hour chart is forming a “Head & Shoulder ” pattern. The neckline is at $1,865. If that level broke and gave a closing below this level on an hourly time frame, then we can expect a good fall of up to $1,750.
On the other hand, a shift in the bullish sentiment could induce fresh buying interest in the second largest cryptocurrency. In that case, a move above the $2,000 level could invalidate the bearish outlook. And the price can be higher than $2100.
ETH is coming in a corrective or retracement phase on all time frames. Below $1,865 closing on the hourly time frame, we can put a trade on the sell side.
Play 10,000+ Casino Games at BC Game with Ease
- Instant Deposits And Withdrawals
- Crypto Casino And Sports Betting
- Exclusive Bonuses And Rewards


Why Trust CoinGape
CoinGape has covered the cryptocurrency industry since 2017, aiming to provide informative insights Read more…to our readers. Our journal analysts bring years of experience in market analysis and blockchain technology to ensure factual accuracy and balanced reporting. By following our Editorial Policy, our writers verify every source, fact-check each story, rely on reputable sources, and attribute quotes and media correctly. We also follow a rigorous Review Methodology when evaluating exchanges and tools. From emerging blockchain projects and coin launches to industry events and technical developments, we cover all facets of the digital asset space with unwavering commitment to timely, relevant information.

Related Articles


- XRP News: Institutional Use Case Expands as Doppler Finance Integrates WXRP for Multi-Chain Access
- Trump Tariffs: Bitcoin Faces Fresh Headwinds as 15% Global Tariffs Begin This Week Amid Iran War
- Bitget Unveils ‘Crypto Anti-Bias Pledge’ To Support Women’s Inclusion In Crypto
- U.S.-Iran War: Crypto Market Rebounds as Iran Reportedly Reaches Out To U.S. To End Conflict
- Bitget Rolls Out Group-Based Maker Rates to Boost Liquidity Across Spot and Futures
- COIN Stock Analysis as Bitcoin Retests $72k Ahead of February NFP Data
- Robinhood Stock Price Prediction As Cathie Wood Buys $12M Dip in Bold ARK Move
- Bitcoin Price At Risk? Professor Who Predicted US-Iran War Says America Could Lose
- Gold Price Prediction March 2026: Rally, Crash, or Record Highs?
- RIOT Stock Prediction as Needham, Piper Sandler Slash Target After Earnings
- Cardano Price Outlook As Charles Hoskinson Warns Over CLARITY Act


