Ethereum Price Analysis: ETH Extends Consolidation Above $1,650; Is $1,900 In Offer?


Ethereum price analysis shows that ETH price rebounded swiftly from the lows of $1,590 and sustained the gains in today’s session. The price moves in a familiar pattern, which is a bullish channel. As the price find support near the higher lower and bounced back. This increases the probability of the continuation of the short-term upside momentum.
The current price action might turn in the favor of the bulls if it follows the previous trend. It is expected that the price could retest the swing high at around $1,730. Further, sustained buying pressure could flip these levels for forming new highs.
- ETH price edges higher following four-day of declines.
- The formation of a green candlestick near the crucial support zone $1,590 indicates the bull’s presence.
- A daily candlestick above $1,700 would further confirm the uptrend in the asset.
ETH price moves north
ETH’s price has been trading in a range from $8,80 to $1282 starting from June 13 for a month. On July 16, the price gave a breakout from the range, and start making higher highs and higher lows on a daily basis. Further, ETH finds good support at 20-day EMA after a minor correction, indicating underlying bullish sentiment.
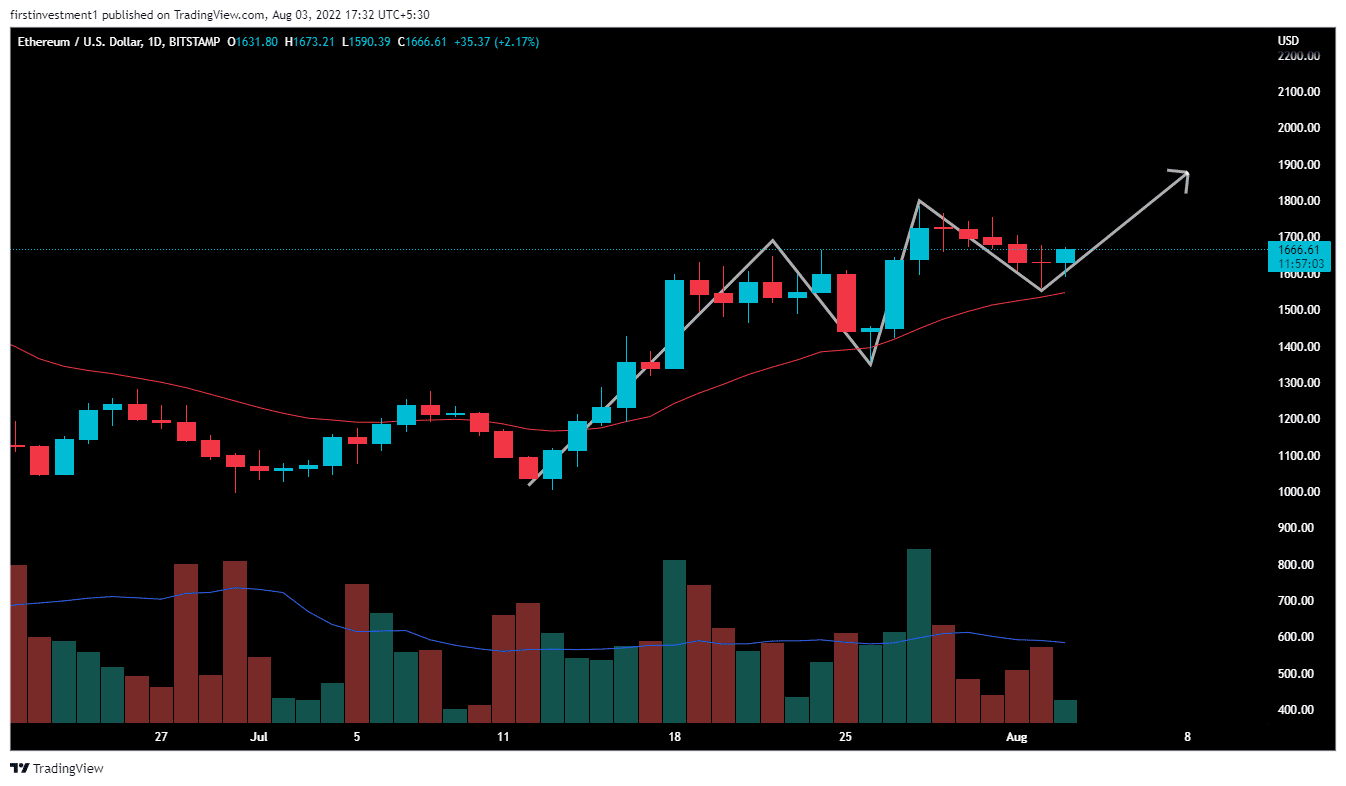
ETH’s price after giving an impulse move from $1,350 to $1,790, takes a retracement from a higher level to the 50% Fibonacci level, which is at $1,567.
The daily chart shows ETH’s price formed a strong support zone near $1,550. Whereas the upside is capped near $1,680. Now, if the price is able to close above $1,680, with good volumes then we can expect a good to bullish momentum up to the highs at $1,800. Next, the bulls would aim for the psychological $1,900 mark.
On the flip side, an acceptance below the session’s low would be a treat for the ETH sellers, targeting $1,400
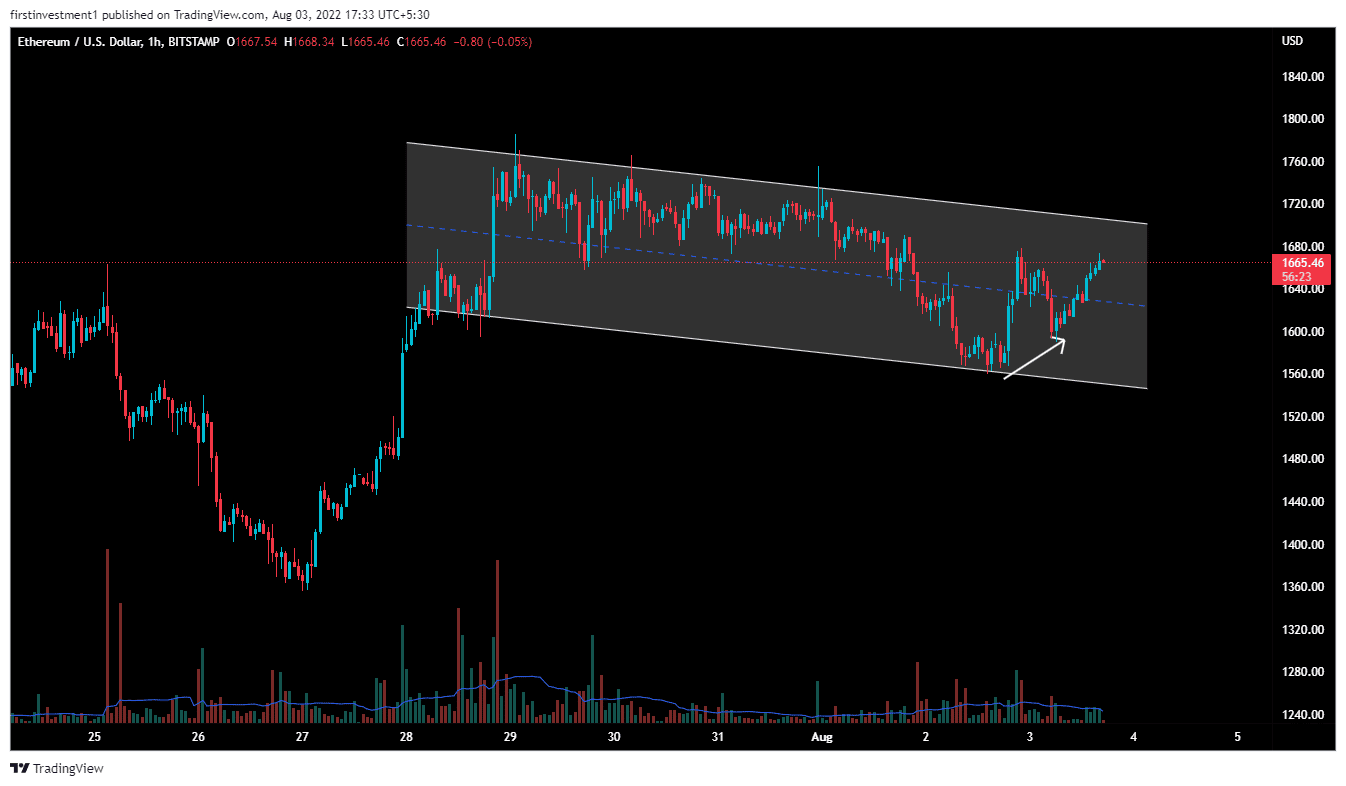
On the hourly time frame, ETH traded in a downside channel. Recently, ETH price formed a higher low, indicating the emergence of buying near the lower levels. A probable reversal in the coming few sessions. In addition, the price is forming Bullish Flag and Pole patterns and is trading in a flag range. A fresh buying bout would result in a breakout on the higher side.
In that case, the first upside target could be found at around $1,760 followed by $1,800.
The second largest cryptocurrency by market cap is trading at $1,657 with nearly 2% of gains as of writing. The 24-hour trading volume stands at $17,939,026,204, down 12.67% , according to CoinMarketCap data.

Why Trust CoinGape
CoinGape has covered the cryptocurrency industry since 2017, aiming to provide informative insights Read more…to our readers. Our journal analysts bring years of experience in market analysis and blockchain technology to ensure factual accuracy and balanced reporting. By following our Editorial Policy, our writers verify every source, fact-check each story, rely on reputable sources, and attribute quotes and media correctly. We also follow a rigorous Review Methodology when evaluating exchanges and tools. From emerging blockchain projects and coin launches to industry events and technical developments, we cover all facets of the digital asset space with unwavering commitment to timely, relevant information.